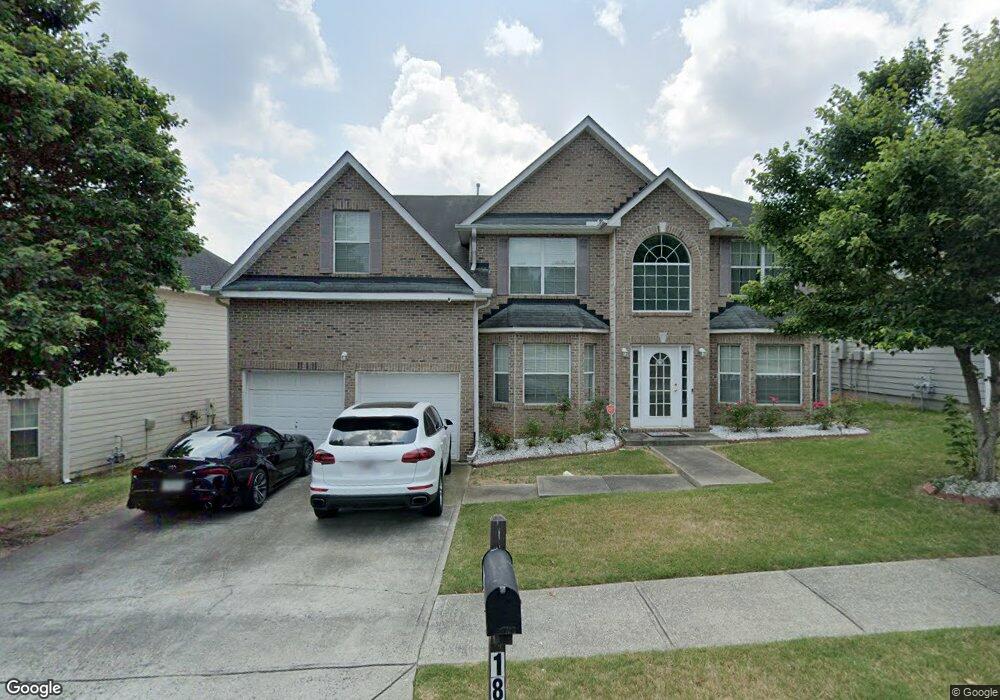
1824 Tulip Petal Rd Unit 2 Auburn, GA 30011
Estimated Value: $399,000 - $461,000
5
Beds
3
Baths
3,377
Sq Ft
$124/Sq Ft
Est. Value
About This Home
This home is located at 1824 Tulip Petal Rd Unit 2, Auburn, GA 30011 and is currently estimated at $419,507, approximately $124 per square foot. 1824 Tulip Petal Rd Unit 2 is a home located in Gwinnett County with nearby schools including Duncan Creek Elementary School, Frank N. Osborne Middle School, and Mill Creek High School.
Ownership History
Date
Name
Owned For
Owner Type
Purchase Details
Closed on
Jul 8, 2025
Sold by
Hossain Showkat
Bought by
Hossain Showkat and Rahman Aminur
Current Estimated Value
Purchase Details
Closed on
Sep 25, 2013
Sold by
Secretary Of Housing And U
Bought by
Hossain Showkat
Home Financials for this Owner
Home Financials are based on the most recent Mortgage that was taken out on this home.
Original Mortgage
$132,144
Interest Rate
4.53%
Mortgage Type
New Conventional
Purchase Details
Closed on
Nov 6, 2012
Sold by
Mayemba Adalaide
Bought by
Flagstar Bank Fsb
Purchase Details
Closed on
Mar 12, 2008
Sold by
Jp Morgan Chase Bk 2006-2
Bought by
Mayemba Adelaide and Hassan Luvumbu
Home Financials for this Owner
Home Financials are based on the most recent Mortgage that was taken out on this home.
Original Mortgage
$183,155
Interest Rate
5.97%
Mortgage Type
FHA
Purchase Details
Closed on
Nov 6, 2007
Sold by
Baffour Robert A
Bought by
Jpmorgan Chase Bank Na 2006-2
Create a Home Valuation Report for This Property
The Home Valuation Report is an in-depth analysis detailing your home's value as well as a comparison with similar homes in the area
Home Values in the Area
Average Home Value in this Area
Purchase History
| Date | Buyer | Sale Price | Title Company |
|---|---|---|---|
| Hossain Showkat | -- | -- | |
| Hossain Showkat | $139,099 | -- | |
| Flagstar Bank Fsb | $184,199 | -- | |
| Secretary Of Housing And Urban | $184,199 | -- | |
| Mayemba Adelaide | $186,100 | -- | |
| Jpmorgan Chase Bank Na 2006-2 | $153,000 | -- |
Source: Public Records
Mortgage History
| Date | Status | Borrower | Loan Amount |
|---|---|---|---|
| Previous Owner | Hossain Showkat | $132,144 | |
| Previous Owner | Mayemba Adelaide | $183,155 |
Source: Public Records
Tax History Compared to Growth
Tax History
| Year | Tax Paid | Tax Assessment Tax Assessment Total Assessment is a certain percentage of the fair market value that is determined by local assessors to be the total taxable value of land and additions on the property. | Land | Improvement |
|---|---|---|---|---|
| 2024 | $6,239 | $165,800 | $26,800 | $139,000 |
| 2023 | $6,239 | $144,400 | $26,800 | $117,600 |
| 2022 | $5,449 | $144,400 | $26,800 | $117,600 |
| 2021 | $4,621 | $119,240 | $20,000 | $99,240 |
| 2020 | $3,681 | $92,600 | $16,000 | $76,600 |
| 2019 | $3,547 | $92,600 | $16,000 | $76,600 |
| 2018 | $3,549 | $92,600 | $16,000 | $76,600 |
| 2016 | $2,735 | $68,880 | $10,800 | $58,080 |
| 2015 | $2,765 | $68,880 | $10,800 | $58,080 |
| 2014 | -- | $55,360 | $10,800 | $44,560 |
Source: Public Records
Map
Nearby Homes
- 4979 Lily Stem Dr
- 4909 Lily Stem Dr
- 4849 Lily Stem Dr
- 6096 Apple Grove Rd
- 6071 Apple Grove Rd
- 5125 Cactus Cove Ln
- 2046 Barberry Dr
- 2070 Cabela Dr
- 5711 Apple Grove Rd
- 5586 Apple Grove Rd
- 4881 Bill Cheek Rd
- 0 Georgia 124 Unit 10590221
- 4657 Water Mill Dr NE
- 2088 Skybrooke Ct
- 4335 Magpie Dr
- 4457 Water Mill Dr
- 4335 Braselton Hwy Unit tax parcel R3003 327
- 1785 Dartford Way
- 1824 Tulip Petal Rd
- 1834 Tulip Petal Rd
- 1834 Tulip Petal Rd Unit 1
- 4966 Lily Stem Dr
- 1825 Lily Stem Trail
- 1815 Lily Stem Trail
- 4956 Lily Stem Dr
- 1835 Lily Stem Trail Unit 1
- 1844 Tulip Petal Rd
- 1823 Tulip Petal Rd
- 1833 Tulip Petal Rd
- 1813 Tulip Petal Rd
- 1845 Lily Stem Trail
- 1843 Tulip Petal Rd
- 1854 Tulip Petal Rd
- 0 Lily Stem Dr Unit 8855871
- 0 Lily Stem Dr Unit 8629789
- 0 Lily Stem Dr Unit 8671811
- 0 Lily Stem Dr Unit 7530480
- 0 Lily Stem Dr Unit 7089150