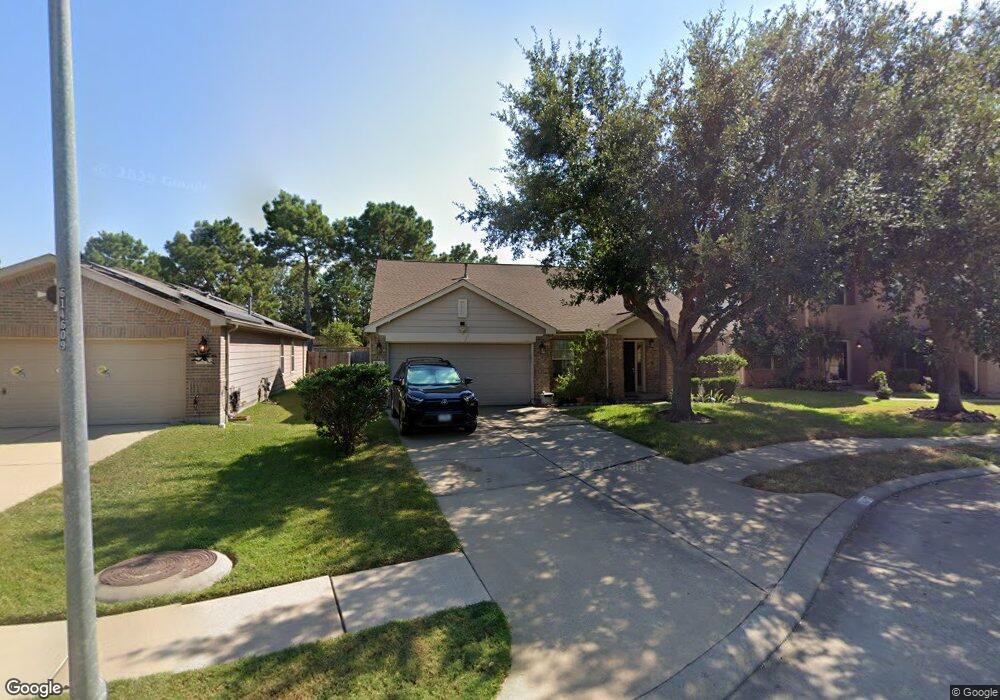
18247 Westridge Bend Ln Cypress, TX 77433
Estimated Value: $285,000 - $325,000
3
Beds
2
Baths
2,051
Sq Ft
$150/Sq Ft
Est. Value
About This Home
This home is located at 18247 Westridge Bend Ln, Cypress, TX 77433 and is currently estimated at $307,815, approximately $150 per square foot. 18247 Westridge Bend Ln is a home located in Harris County with nearby schools including Copeland Elementary School, Kahla Middle School, and Cypress Springs High School.
Ownership History
Date
Name
Owned For
Owner Type
Purchase Details
Closed on
Aug 30, 2022
Sold by
Thi Nguyen Huong
Bought by
Nguyen Kevin Khoi
Current Estimated Value
Purchase Details
Closed on
Sep 27, 2013
Sold by
Sadler Joe G and Sadler Deanna Nicole
Bought by
Nguyen Binh Quoc and Le Van Thu
Home Financials for this Owner
Home Financials are based on the most recent Mortgage that was taken out on this home.
Original Mortgage
$142,000
Interest Rate
4.46%
Mortgage Type
New Conventional
Purchase Details
Closed on
Jul 13, 2006
Sold by
Kb Home Lone Star Lp
Bought by
Sadler Joe G and Sadler Deanna Nicole
Home Financials for this Owner
Home Financials are based on the most recent Mortgage that was taken out on this home.
Original Mortgage
$27,540
Interest Rate
6.62%
Mortgage Type
Stand Alone Second
Create a Home Valuation Report for This Property
The Home Valuation Report is an in-depth analysis detailing your home's value as well as a comparison with similar homes in the area
Home Values in the Area
Average Home Value in this Area
Purchase History
| Date | Buyer | Sale Price | Title Company |
|---|---|---|---|
| Nguyen Kevin Khoi | -- | -- | |
| Nguyen Kevin Khoi | -- | -- | |
| Nguyen Binh Quoc | -- | None Available | |
| Sadler Joe G | -- | First American Title |
Source: Public Records
Mortgage History
| Date | Status | Borrower | Loan Amount |
|---|---|---|---|
| Previous Owner | Nguyen Binh Quoc | $142,000 | |
| Previous Owner | Sadler Joe G | $27,540 | |
| Previous Owner | Sadler Joe G | $110,160 |
Source: Public Records
Tax History Compared to Growth
Tax History
| Year | Tax Paid | Tax Assessment Tax Assessment Total Assessment is a certain percentage of the fair market value that is determined by local assessors to be the total taxable value of land and additions on the property. | Land | Improvement |
|---|---|---|---|---|
| 2025 | $3,929 | $280,207 | $57,836 | $222,371 |
| 2024 | $3,929 | $300,194 | $57,836 | $242,358 |
| 2023 | $3,929 | $281,644 | $65,107 | $216,537 |
| 2022 | $5,487 | $252,554 | $43,294 | $209,260 |
| 2021 | $5,401 | $203,205 | $43,294 | $159,911 |
| 2020 | $5,270 | $189,270 | $34,701 | $154,569 |
| 2019 | $5,193 | $181,200 | $34,701 | $146,499 |
| 2018 | $1,588 | $169,074 | $34,701 | $134,373 |
| 2017 | $4,965 | $169,074 | $34,701 | $134,373 |
| 2016 | $4,786 | $163,000 | $34,701 | $128,299 |
| 2015 | $4,423 | $158,276 | $34,701 | $123,575 |
| 2014 | $4,423 | $145,787 | $34,701 | $111,086 |
Source: Public Records
Map
Nearby Homes
- 7619 Park Sage Ln
- 7622 Crestbrook Manor Ln
- 18227 Fair Grange Ln
- 20915 Grand Surprise Ct
- 18015 Redbud Terrace Ln
- 18110 Rexine Ln
- 7626 Pasture Bend Ct
- 7639 Golden Thistle Ln
- 7951 Barker Cypress Rd
- 18403 Fair Grange Ln
- 7734 Pasture Bend Ln
- 7218 Glenwick Ct
- 7519 Grand Terrace Ct
- 7918 Blue Wahoo Ln
- 7750 Shavano Ln
- 18315 Crossland Ct
- 18114 Shallow Leaf Ln
- 7206 Thornmeadow Ln
- 18639 White Barnwood
- 18002 Stoney Glade Ct
- 18243 Westridge Bend Ln
- 18251 Westridge Bend Ln
- 18239 Westridge Bend Ln
- 7603 Sapulpa Ln
- 18235 Westridge Bend Ln
- 7607 Sapulpa Ln
- 18242 Westridge Bend Ln
- 7526 Parkcross Place
- 18238 Westridge Bend Ln
- 7527 Parkcross Place
- 18231 Westridge Bend Ln
- 7611 Sapulpa Ln
- 7531 Rain Meadow Ln
- 18234 Westridge Bend Ln
- 7522 Parkcross Place
- 18227 Westridge Bend Ln
- 7523 Parkcross Place
- 7615 Sapulpa Ln
- 18227 Breezy Glen Ln
- 18230 Westridge Bend Ln