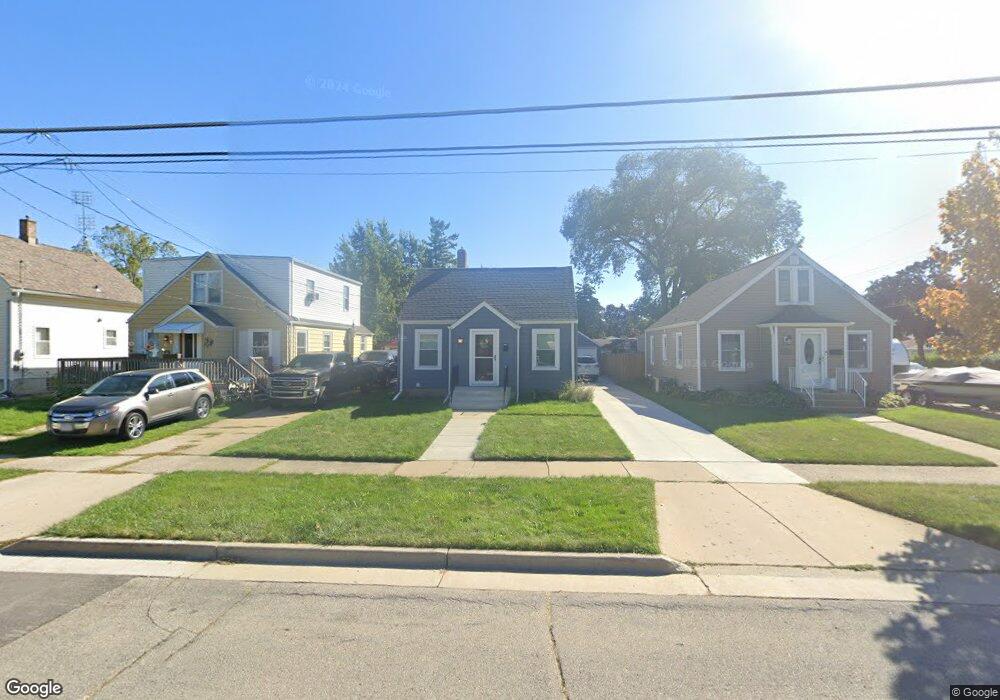
1825 35th St Kenosha, WI 53140
Grant NeighborhoodEstimated Value: $254,000 - $279,000
3
Beds
2
Baths
1,330
Sq Ft
$199/Sq Ft
Est. Value
About This Home
This home is located at 1825 35th St, Kenosha, WI 53140 and is currently estimated at $264,245, approximately $198 per square foot. 1825 35th St is a home located in Kenosha County with nearby schools including Grant Elementary School, Washington Middle School, and Bradford High School.
Ownership History
Date
Name
Owned For
Owner Type
Purchase Details
Closed on
Feb 5, 2020
Sold by
Evolve Property Solutions Llc
Bought by
Fox Andrew J
Current Estimated Value
Home Financials for this Owner
Home Financials are based on the most recent Mortgage that was taken out on this home.
Original Mortgage
$162,000
Outstanding Balance
$142,304
Interest Rate
3.74%
Mortgage Type
New Conventional
Estimated Equity
$121,941
Purchase Details
Closed on
Apr 19, 2019
Sold by
Belle Shawn R
Bought by
Evolve Property Solutions Llc
Create a Home Valuation Report for This Property
The Home Valuation Report is an in-depth analysis detailing your home's value as well as a comparison with similar homes in the area
Home Values in the Area
Average Home Value in this Area
Purchase History
| Date | Buyer | Sale Price | Title Company |
|---|---|---|---|
| Fox Andrew J | -- | None Available | |
| Evolve Property Solutions Llc | $100,000 | None Available |
Source: Public Records
Mortgage History
| Date | Status | Borrower | Loan Amount |
|---|---|---|---|
| Open | Fox Andrew J | $162,000 |
Source: Public Records
Tax History
| Year | Tax Paid | Tax Assessment Tax Assessment Total Assessment is a certain percentage of the fair market value that is determined by local assessors to be the total taxable value of land and additions on the property. | Land | Improvement |
|---|---|---|---|---|
| 2025 | $3,382 | $210,400 | $32,600 | $177,800 |
| 2024 | $3,167 | $137,000 | $22,100 | $114,900 |
| 2023 | $3,167 | $137,000 | $22,100 | $114,900 |
| 2022 | $3,213 | $137,000 | $22,100 | $114,900 |
| 2021 | $3,295 | $137,000 | $22,100 | $114,900 |
| 2020 | $3,413 | $137,000 | $22,100 | $114,900 |
| 2019 | $2,702 | $114,500 | $22,100 | $92,400 |
| 2018 | $2,979 | $100,800 | $22,100 | $78,700 |
| 2017 | $2,970 | $100,800 | $22,100 | $78,700 |
| 2016 | $2,530 | $100,800 | $22,100 | $78,700 |
| 2015 | $2,681 | $102,100 | $25,600 | $76,500 |
| 2014 | $2,658 | $102,100 | $25,600 | $76,500 |
Source: Public Records
Map
Nearby Homes
Your Personal Tour Guide
Ask me questions while you tour the home.