1825 Barbary Way Belleville, IL 62226
Estimated Value: $368,000 - $430,000
--
Bed
--
Bath
1,904
Sq Ft
$206/Sq Ft
Est. Value
About This Home
This home is located at 1825 Barbary Way, Belleville, IL 62226 and is currently estimated at $391,436, approximately $205 per square foot. 1825 Barbary Way is a home located in St. Clair County with nearby schools including Abraham Lincoln Elementary School, West Jr High School, and Elite Scholars STEAM Academy.
Ownership History
Date
Name
Owned For
Owner Type
Purchase Details
Closed on
Aug 30, 2005
Sold by
The Jones Co Homes Llc
Bought by
Amanat Zohreh and Sadrerafi Enayatollah
Current Estimated Value
Home Financials for this Owner
Home Financials are based on the most recent Mortgage that was taken out on this home.
Original Mortgage
$241,400
Outstanding Balance
$145,014
Interest Rate
7.87%
Mortgage Type
Fannie Mae Freddie Mac
Estimated Equity
$246,422
Purchase Details
Closed on
Mar 15, 2005
Sold by
Walson Henry L and Graham Walson Linda F
Bought by
The Jones Co Homes Llc
Purchase Details
Closed on
Jun 26, 2003
Sold by
The Jones Company Homes Llc
Bought by
Walson Henry L and Graham Walson Linda F
Home Financials for this Owner
Home Financials are based on the most recent Mortgage that was taken out on this home.
Original Mortgage
$277,191
Interest Rate
5.4%
Mortgage Type
Seller Take Back
Create a Home Valuation Report for This Property
The Home Valuation Report is an in-depth analysis detailing your home's value as well as a comparison with similar homes in the area
Home Values in the Area
Average Home Value in this Area
Purchase History
| Date | Buyer | Sale Price | Title Company |
|---|---|---|---|
| Amanat Zohreh | $284,000 | Commerce Land Title Inc | |
| The Jones Co Homes Llc | $317,000 | Benchmark Title Company | |
| Walson Henry L | $292,000 | Benchmark Title Company |
Source: Public Records
Mortgage History
| Date | Status | Borrower | Loan Amount |
|---|---|---|---|
| Open | Amanat Zohreh | $241,400 | |
| Previous Owner | Walson Henry L | $277,191 |
Source: Public Records
Tax History Compared to Growth
Tax History
| Year | Tax Paid | Tax Assessment Tax Assessment Total Assessment is a certain percentage of the fair market value that is determined by local assessors to be the total taxable value of land and additions on the property. | Land | Improvement |
|---|---|---|---|---|
| 2024 | $6,501 | $113,005 | $15,436 | $97,569 |
| 2023 | $7,435 | $99,653 | $15,224 | $84,429 |
| 2022 | $6,968 | $90,758 | $13,865 | $76,893 |
| 2021 | $6,840 | $87,033 | $13,296 | $73,737 |
| 2020 | $6,604 | $81,052 | $12,382 | $68,670 |
| 2019 | $5,958 | $75,655 | $12,636 | $63,019 |
| 2018 | $5,835 | $73,723 | $12,313 | $61,410 |
| 2017 | $5,744 | $71,761 | $11,985 | $59,776 |
| 2016 | $5,784 | $69,288 | $11,572 | $57,716 |
| 2014 | $4,983 | $69,275 | $13,324 | $55,951 |
| 2013 | $4,931 | $69,275 | $13,324 | $55,951 |
Source: Public Records
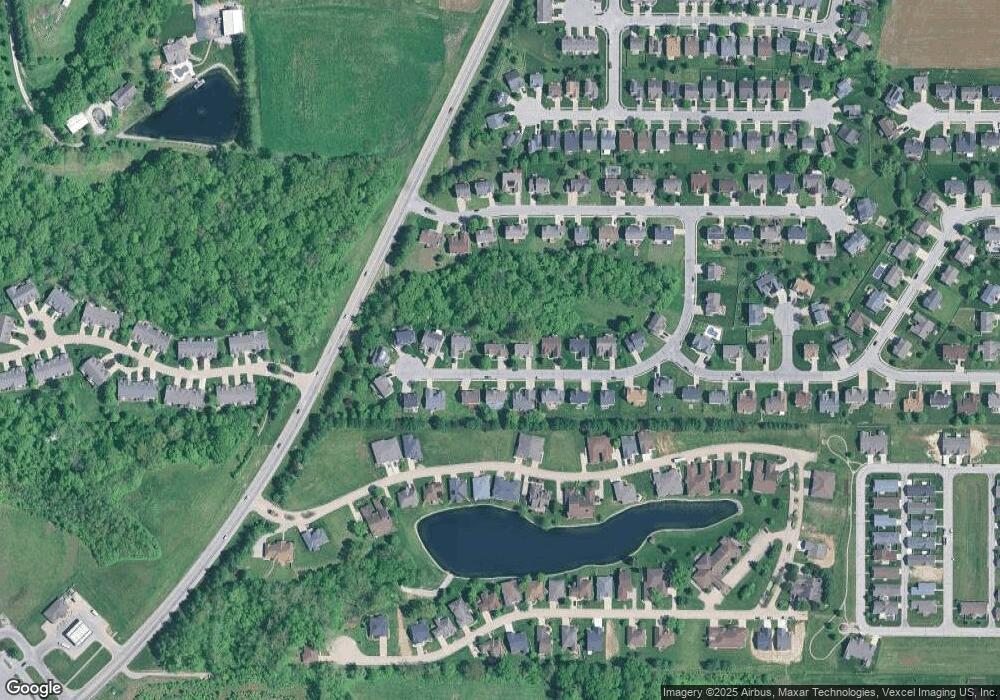
Map
Nearby Homes
- 1853 Carrington Way Unit 55
- 1859 Carrington Way Unit 61
- 1833 Carrington Way
- 1855 Carrington Way
- 1829 Carrington Way
- 1835 Carrington Way
- 1830 Stafford Way
- 1920 Hawksbill Dr
- 1939 Hawksbill Dr
- 3909 Finch Ln
- 1757 Old Park Ln
- 3928 Finch Ln
- 1809 Old Park Ln
- 1813 Old Park Ln
- 3924 Finch Ln
- 1753 Old Park Ln
- 3920 Finch Ln
- 3916 Finch Ln
- 1817 Old Park Ln
- 1749 Old Park Ln
- 1819 Barbary Way
- 1829 Barbary Way
- 1824 Barbary Way
- 1815 Barbary Way
- 1833 Barbary Way
- 1820 Barbary Way
- 1816 Barbary Way
- 1811 Barbary Way
- 1837 Barbary Way
- 1847TBB Carrington Way
- 1847 Carrington Way Unit 49
- 1853TBB Carrington Way
- 1855TBB Carrington Way
- 1843 Carrington Way
- 1812 Barbary Way
- 1836 Barbary Way
- 1826 Dalton Dr
- 1830 Dalton Dr
- 1841 Carrington Way Unit 43