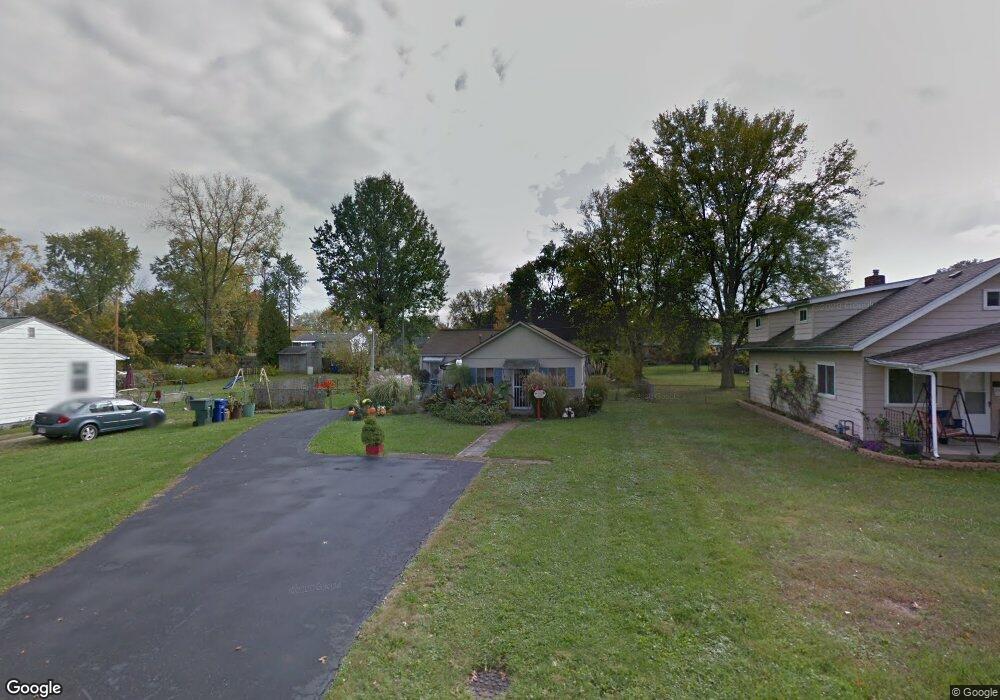
1825 Case Rd Columbus, OH 43224
North Linden NeighborhoodEstimated Value: $136,022 - $186,000
3
Beds
1
Bath
920
Sq Ft
$179/Sq Ft
Est. Value
About This Home
This home is located at 1825 Case Rd, Columbus, OH 43224 and is currently estimated at $164,256, approximately $178 per square foot. 1825 Case Rd is a home located in Franklin County with nearby schools including North Linden Elementary School, Medina Middle School, and Mifflin High School.
Ownership History
Date
Name
Owned For
Owner Type
Purchase Details
Closed on
Feb 4, 2014
Sold by
Yarnell Roberta M and Yarnell Clyde E
Bought by
Smith Kathleen A
Current Estimated Value
Home Financials for this Owner
Home Financials are based on the most recent Mortgage that was taken out on this home.
Original Mortgage
$27,160
Outstanding Balance
$20,401
Interest Rate
4.49%
Mortgage Type
New Conventional
Estimated Equity
$143,855
Purchase Details
Closed on
Oct 12, 2004
Sold by
Yarnell Roberta M
Bought by
Yarnell Clyde E and Yarnell Roberta M
Purchase Details
Closed on
Mar 31, 1977
Bought by
Yarnell Roberta M
Create a Home Valuation Report for This Property
The Home Valuation Report is an in-depth analysis detailing your home's value as well as a comparison with similar homes in the area
Home Values in the Area
Average Home Value in this Area
Purchase History
| Date | Buyer | Sale Price | Title Company |
|---|---|---|---|
| Smith Kathleen A | $28,000 | Ohio Title | |
| Yarnell Clyde E | -- | -- | |
| Yarnell Roberta M | -- | -- |
Source: Public Records
Mortgage History
| Date | Status | Borrower | Loan Amount |
|---|---|---|---|
| Open | Smith Kathleen A | $27,160 |
Source: Public Records
Tax History
| Year | Tax Paid | Tax Assessment Tax Assessment Total Assessment is a certain percentage of the fair market value that is determined by local assessors to be the total taxable value of land and additions on the property. | Land | Improvement |
|---|---|---|---|---|
| 2025 | $1,271 | $38,120 | $12,290 | $25,830 |
| 2024 | $1,271 | $38,120 | $12,290 | $25,830 |
| 2023 | $1,283 | $38,115 | $12,285 | $25,830 |
| 2022 | $708 | $22,410 | $8,230 | $14,180 |
| 2021 | $710 | $22,410 | $8,230 | $14,180 |
| 2020 | $711 | $22,410 | $8,230 | $14,180 |
| 2019 | $1,087 | $17,920 | $6,580 | $11,340 |
| 2018 | $837 | $17,920 | $6,580 | $11,340 |
| 2017 | $868 | $17,920 | $6,580 | $11,340 |
| 2016 | $650 | $9,810 | $5,080 | $4,730 |
| 2015 | $590 | $9,810 | $5,080 | $4,730 |
| 2014 | $999 | $9,810 | $5,080 | $4,730 |
| 2013 | $547 | $17,885 | $5,635 | $12,250 |
Source: Public Records
Map
Nearby Homes
- 1874 Sale Rd
- 1863 Ward Rd
- 1997 Ferris Rd
- 3750 Dresden St
- 1637 Sale Rd
- 2023 Ferris Rd
- 2045 Sale Rd
- 1946 Lehner Rd
- 2081 Ormond Ave
- 2010 Melrose Ave
- 2100 Ferris Rd
- 3583 Dresden St
- 3939 Karl Rd Unit 311
- 3967 Karl Rd Unit 224
- 3508 Kenlawn St
- 2267 Ferris Rd
- 3941 Karl Rd Unit 326
- 2283 Ward Rd
- 3620 Walmar Dr
- 4143 Karl Rd Unit 314
Your Personal Tour Guide
Ask me questions while you tour the home.