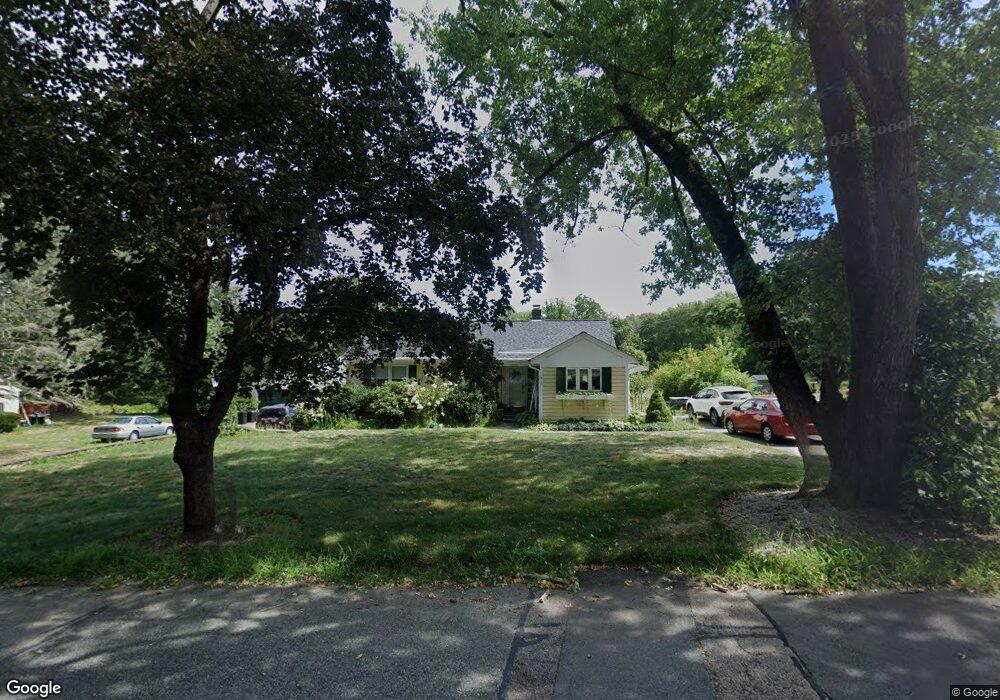
1825 Elm St Dighton, MA 02715
Estimated Value: $474,000 - $537,000
3
Beds
2
Baths
1,212
Sq Ft
$406/Sq Ft
Est. Value
About This Home
This home is located at 1825 Elm St, Dighton, MA 02715 and is currently estimated at $491,518, approximately $405 per square foot. 1825 Elm St is a home located in Bristol County with nearby schools including Dighton-Rehoboth Regional High School.
Ownership History
Date
Name
Owned For
Owner Type
Purchase Details
Closed on
Apr 5, 2021
Sold by
Barrow Kenneth G
Bought by
Edinger Tammy A and Edinger Donald D
Current Estimated Value
Home Financials for this Owner
Home Financials are based on the most recent Mortgage that was taken out on this home.
Original Mortgage
$299,250
Outstanding Balance
$269,310
Interest Rate
2.8%
Mortgage Type
Purchase Money Mortgage
Estimated Equity
$222,208
Purchase Details
Closed on
Jun 28, 2006
Sold by
Barrow Elaine C and Barrow Kenneth G
Bought by
Barrow Elaine C and Barrow Kenneth G
Create a Home Valuation Report for This Property
The Home Valuation Report is an in-depth analysis detailing your home's value as well as a comparison with similar homes in the area
Home Values in the Area
Average Home Value in this Area
Purchase History
| Date | Buyer | Sale Price | Title Company |
|---|---|---|---|
| Edinger Tammy A | $315,000 | None Available | |
| Barrow Elaine C | -- | -- | |
| Barrow Elaine C | -- | -- |
Source: Public Records
Mortgage History
| Date | Status | Borrower | Loan Amount |
|---|---|---|---|
| Open | Edinger Tammy A | $299,250 | |
| Closed | Edinger Tammy A | $299,250 | |
| Previous Owner | Barrow Elaine C | $102,200 | |
| Previous Owner | Barrow Elaine C | $90,000 |
Source: Public Records
Tax History Compared to Growth
Tax History
| Year | Tax Paid | Tax Assessment Tax Assessment Total Assessment is a certain percentage of the fair market value that is determined by local assessors to be the total taxable value of land and additions on the property. | Land | Improvement |
|---|---|---|---|---|
| 2025 | $5,027 | $400,200 | $135,500 | $264,700 |
| 2024 | $5,011 | $366,300 | $134,800 | $231,500 |
| 2023 | $4,800 | $344,300 | $134,800 | $209,500 |
| 2022 | $4,390 | $307,200 | $114,100 | $193,100 |
| 2021 | $4,154 | $280,100 | $103,000 | $177,100 |
| 2020 | $4,217 | $281,500 | $115,300 | $166,200 |
| 2019 | $3,954 | $263,800 | $115,300 | $148,500 |
| 2018 | $3,634 | $244,400 | $97,700 | $146,700 |
| 2017 | $3,539 | $236,900 | $113,800 | $123,100 |
| 2016 | $3,550 | $233,100 | $117,200 | $115,900 |
| 2015 | $3,403 | $229,900 | $120,600 | $109,300 |
| 2014 | $3,416 | $224,300 | $120,600 | $103,700 |
Source: Public Records
Map
Nearby Homes