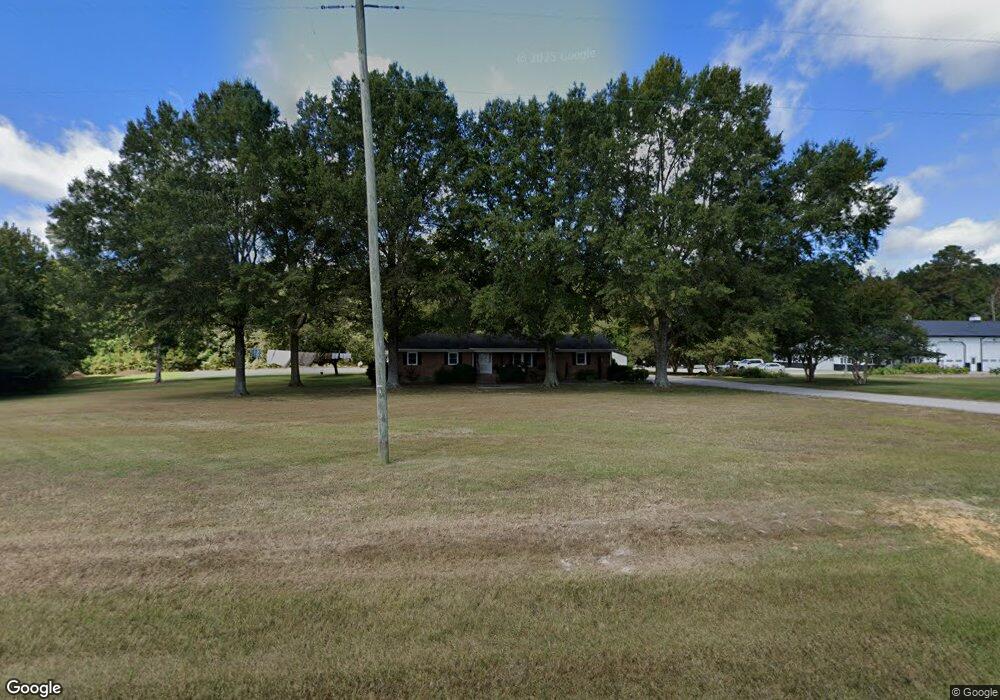
1825 Hickory Rock Rd Louisburg, NC 27549
Estimated Value: $259,604
3
Beds
1
Bath
1,200
Sq Ft
$216/Sq Ft
Est. Value
About This Home
This home is located at 1825 Hickory Rock Rd, Louisburg, NC 27549 and is currently priced at $259,604, approximately $216 per square foot. 1825 Hickory Rock Rd is a home located in Franklin County with nearby schools including Edward Best Elementary School, Terrell Lane Middle School, and Louisburg High School.
Ownership History
Date
Name
Owned For
Owner Type
Purchase Details
Closed on
Feb 24, 2025
Sold by
Stallings Catherine T and Stallings Leo W
Bought by
Stallings Catherine T and Stallings Leo W
Current Estimated Value
Purchase Details
Closed on
May 31, 2023
Sold by
Tharrington Ricky D and Tharrington Terry G
Bought by
Tharrington Norman A
Purchase Details
Closed on
Oct 21, 2021
Sold by
Cozart Joint Revocable Trust
Bought by
T & T Logging Llc
Purchase Details
Closed on
Dec 6, 2017
Sold by
Cozart James E and Cozart Janet T
Bought by
Cozart James F and Cozart Janet T
Purchase Details
Closed on
Jan 7, 2014
Sold by
Tharrington Norman A and Tharrington Martha H
Bought by
Tharrington Norman Allen
Purchase Details
Closed on
Nov 14, 2013
Sold by
Tharrington Elsie C
Bought by
Tharrington Norman A and Stallings Catherine T
Create a Home Valuation Report for This Property
The Home Valuation Report is an in-depth analysis detailing your home's value as well as a comparison with similar homes in the area
Home Values in the Area
Average Home Value in this Area
Purchase History
| Date | Buyer | Sale Price | Title Company |
|---|---|---|---|
| Stallings Catherine T | -- | None Listed On Document | |
| Stallings Catherine T | -- | None Listed On Document | |
| Tharrington Norman A | $108,000 | None Listed On Document | |
| T & T Logging Llc | $112,000 | Williamson B N | |
| Cozart James F | -- | None Available | |
| Tharrington Norman Allen | -- | None Available | |
| Tharrington Norman A | -- | None Available |
Source: Public Records
Tax History Compared to Growth
Tax History
| Year | Tax Paid | Tax Assessment Tax Assessment Total Assessment is a certain percentage of the fair market value that is determined by local assessors to be the total taxable value of land and additions on the property. | Land | Improvement |
|---|---|---|---|---|
| 2025 | $479 | $442,680 | $442,680 | $0 |
| 2024 | $479 | $442,680 | $442,680 | $0 |
| 2023 | $701 | $208,990 | $188,080 | $20,910 |
| 2022 | $678 | $208,990 | $188,080 | $20,910 |
| 2021 | $676 | $208,990 | $188,080 | $20,910 |
| 2020 | $680 | $208,990 | $188,080 | $20,910 |
| 2019 | $662 | $208,990 | $188,080 | $20,910 |
| 2018 | $657 | $208,990 | $188,080 | $20,910 |
| 2017 | $638 | $173,650 | $163,670 | $9,980 |
| 2016 | $659 | $173,650 | $163,670 | $9,980 |
| 2015 | $659 | $173,650 | $163,670 | $9,980 |
| 2014 | $485 | $173,650 | $163,670 | $9,980 |
Source: Public Records
Map
Nearby Homes
- 2329 N Carolina 561
- 592 Perdues Rd
- 0 Shortleaf Dr Unit 10119597
- Cypress Springs Dr
- 0 Cypress Creek Dr
- 08 Tillery Dr
- 376 T K Allen Rd
- 06 Tillery Dr
- 09 Tillery Dr
- 45 Leisure Ln
- 55 Leisure Ln
- 70 Leisure Ln
- 11 Tillery Dr
- 15 Gina Lee Terrace
- 109 Drew St
- 317 Brewer Rd
- 150 Alston Pruitt Rd
- 491 Nc 56 Hwy E
- 0 Pearces Rd Unit 10098328
- 7.69 Acres N Carolina 561
- 1825 Hickory Rock Rd
- 1825 Hickory Rock Rd
- 2398 Ronald Tharrington Rd
- 1773 Hickory Rock Rd
- 1756 Hickory Rock Rd
- 2453 Ronald Tharrington Rd
- 2453 Ronald Tharrington Rd
- 1726 Hickory Rock Rd
- 1696 Hickory Rock Rd
- 1690 Hickory Rock Rd
- 1649 Hickory Rock Rd
- 2003 Hickory Rock Rd
- 1714 Firetower Rd
- 1734 Firetower Rd
- 1724 Firetower Rd
- 2217 Ronald Tharrington Rd
- 2217 Ronald Tharrington Rd
- 1710 Firetower Rd
- 1698 Firetower Rd
- 1656 Firetower Rd