
Landlord's Agent in 2023
Susan Lozano
@properties Christie's Int'l R E Clarkston
(248) 421-7313
3 in this area
25 Total Sales
Estimated Value: $1,064,172 - $1,200,000
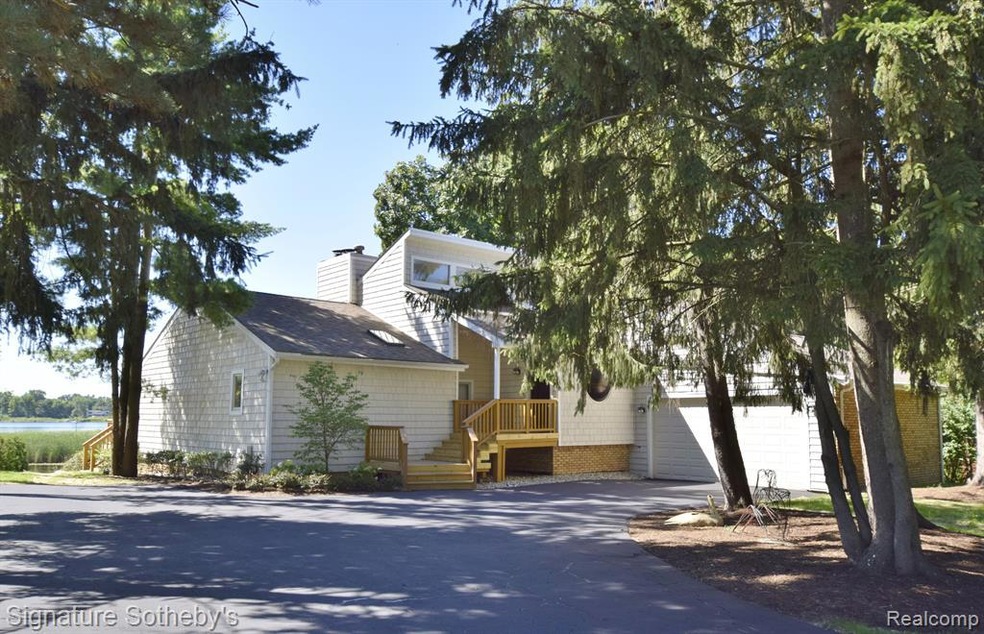
Total square footage with walkout lower is 4285. Beautiful setting on all sports Upper Long Lake, which connects to Forest and Lower Long lakes. Sensational light drenched interior with tons of open living and entertaining spaces. Lake boat dock for your use. Many upgrades including: whole house repainted, wood floors refinished, whole house plumbing repair, deck and porch refinished. New landscaping, new drain system, window treatments, screens, toilets and seats, dishwasher, refrigerator, washer, dryer heating unit and air filter (additional features included see docs for details). The house is gleaming and ready for someone's private lakefront enjoyment.
Last Agent to Rent the Property
@properties Christie's Int'l R E Clarkston License #6501112805 Listed on: 05/31/2023
| Date | Buyer | Sale Price | Title Company |
|---|---|---|---|
| Friedman Eugene | -- | Interstate Title Inc | |
| Roy Manjula An | -- | -- |
| Date | Event | Price | List to Sale | Price per Sq Ft | Prior Sale |
|---|---|---|---|---|---|
| 08/01/2023 08/01/23 | Rented | $4,700 | -4.1% | -- | |
| 07/06/2023 07/06/23 | Under Contract | -- | -- | -- | |
| 05/31/2023 05/31/23 | For Rent | $4,900 | -16.9% | -- | |
| 01/18/2023 01/18/23 | Rented | $5,900 | 0.0% | -- | |
| 11/21/2022 11/21/22 | For Rent | $5,900 | +73.5% | -- | |
| 05/18/2019 05/18/19 | Rented | $3,400 | -2.9% | -- | |
| 05/18/2019 05/18/19 | Under Contract | -- | -- | -- | |
| 02/04/2019 02/04/19 | For Rent | $3,500 | +6.1% | -- | |
| 01/15/2018 01/15/18 | Rented | $3,300 | -5.7% | -- | |
| 08/10/2017 08/10/17 | For Rent | $3,500 | +20.7% | -- | |
| 02/18/2016 02/18/16 | Rented | $2,900 | -21.6% | -- | |
| 02/08/2016 02/08/16 | Under Contract | -- | -- | -- | |
| 07/27/2015 07/27/15 | For Rent | $3,700 | +37.0% | -- | |
| 07/16/2014 07/16/14 | Rented | $2,700 | -22.9% | -- | |
| 07/14/2014 07/14/14 | Under Contract | -- | -- | -- | |
| 06/19/2014 06/19/14 | For Rent | $3,500 | 0.0% | -- | |
| 06/17/2014 06/17/14 | Sold | $550,000 | -7.7% | $213 / Sq Ft | View Prior Sale |
| 05/30/2014 05/30/14 | Pending | -- | -- | -- | |
| 05/01/2014 05/01/14 | For Sale | $595,900 | 0.0% | $231 / Sq Ft | |
| 01/13/2012 01/13/12 | Rented | $3,000 | -6.3% | -- | |
| 01/09/2012 01/09/12 | Under Contract | -- | -- | -- | |
| 12/06/2011 12/06/11 | For Rent | $3,200 | -- | -- |
| Year | Tax Paid | Tax Assessment Tax Assessment Total Assessment is a certain percentage of the fair market value that is determined by local assessors to be the total taxable value of land and additions on the property. | Land | Improvement |
|---|---|---|---|---|
| 2024 | $15,400 | $465,730 | $0 | $0 |
| 2023 | $14,680 | $429,920 | $0 | $0 |
| 2022 | $19,430 | $414,580 | $0 | $0 |
| 2021 | $18,919 | $410,460 | $0 | $0 |
| 2020 | $13,430 | $402,010 | $0 | $0 |
| 2019 | $18,672 | $390,780 | $0 | $0 |
| 2018 | $18,199 | $382,470 | $0 | $0 |
| 2017 | $17,791 | $373,050 | $0 | $0 |
| 2016 | $17,730 | $356,880 | $0 | $0 |
| 2015 | -- | $345,830 | $0 | $0 |
| 2014 | -- | $311,050 | $0 | $0 |
| 2011 | -- | $255,410 | $0 | $0 |
Landlord's Agent in 2023
Susan Lozano
@properties Christie's Int'l R E Clarkston
(248) 421-7313
3 in this area
25 Total Sales
Tenant's Agent in 2023
Rania Zakkar
RE/MAX
(248) 219-9120
11 in this area
50 Total Sales
R
Seller's Agent in 2019
Ronni Keating
KW Domain
Buyer's Agent in 2019
James Danley
KW Domain
(248) 671-3092
16 in this area
197 Total Sales
K
Buyer's Agent in 2018
Katrice McCormick
RE/MAX
Seller's Agent in 2014
Silvia Stan
Signature Sotheby's International Realty Bham
(313) 622-6937
4 in this area
28 Total Sales
Source: Realcomp
MLS Number: 20230042905
APN: 19-07-176-008
Disclaimer: Certain information contained herein is derived from information provided by parties other than Homes.com. All information provided is deemed reliable, but is not guaranteed to be accurate and should be independently verified.
![]() IDX provided courtesy of Realcomp II Ltd. via Ten-X and MLS
IDX provided courtesy of Realcomp II Ltd. via Ten-X and MLS
Copyright 2025 Realcomp II Ltd. Shareholders
IDX information is provided exclusively for consumers' personal, noncommercial use and may not be used for any purpose other than to identify prospective properties consumers may be interested in purchasing. The accuracy of all information, regardless of source, is not guaranteed or warranted. All information should be independently verified.
Listing Information presented by local MLS brokerage: Ten-X, local REALTOR®- Arlene Richardson - (888)-952-6393