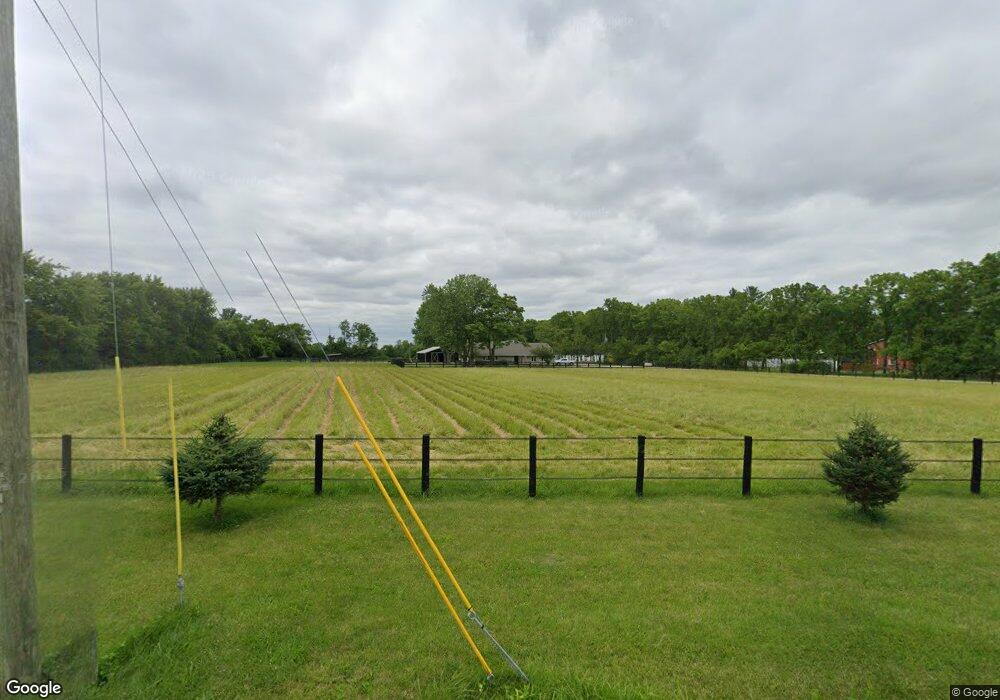
1825 Old Springfield Rd Vandalia, OH 45377
Estimated Value: $360,000 - $498,000
3
Beds
2
Baths
4,287
Sq Ft
$102/Sq Ft
Est. Value
About This Home
This home is located at 1825 Old Springfield Rd, Vandalia, OH 45377 and is currently estimated at $437,738, approximately $102 per square foot. 1825 Old Springfield Rd is a home located in Montgomery County with nearby schools including Helke Elementary School, Morton Middle School, and Butler High School.
Ownership History
Date
Name
Owned For
Owner Type
Purchase Details
Closed on
Mar 22, 2013
Sold by
Slagel Ben and Slagel Miranda
Bought by
Hauer Holly J
Current Estimated Value
Home Financials for this Owner
Home Financials are based on the most recent Mortgage that was taken out on this home.
Original Mortgage
$71,186
Outstanding Balance
$50,189
Interest Rate
3.52%
Mortgage Type
FHA
Estimated Equity
$387,549
Purchase Details
Closed on
Feb 28, 2013
Sold by
Deal Richard B and Deal Barbara J
Bought by
Taufmann Jennifer and Taufmann Timothy D
Home Financials for this Owner
Home Financials are based on the most recent Mortgage that was taken out on this home.
Original Mortgage
$71,186
Outstanding Balance
$50,189
Interest Rate
3.52%
Mortgage Type
FHA
Estimated Equity
$387,549
Purchase Details
Closed on
Jun 22, 2001
Sold by
Estate Of Katharine Deal
Bought by
Deal Richard B
Purchase Details
Closed on
May 10, 2001
Sold by
Estate Of Katharine Dral
Bought by
Deal Richard B
Create a Home Valuation Report for This Property
The Home Valuation Report is an in-depth analysis detailing your home's value as well as a comparison with similar homes in the area
Home Values in the Area
Average Home Value in this Area
Purchase History
| Date | Buyer | Sale Price | Title Company |
|---|---|---|---|
| Hauer Holly J | $75,000 | Sterling Land Title North Ll | |
| Taufmann Jennifer | $160,000 | Sterling Land Title North Ll | |
| Deal Richard B | -- | -- | |
| Deal Richard B | -- | -- |
Source: Public Records
Mortgage History
| Date | Status | Borrower | Loan Amount |
|---|---|---|---|
| Open | Hauer Holly J | $71,186 |
Source: Public Records
Tax History Compared to Growth
Tax History
| Year | Tax Paid | Tax Assessment Tax Assessment Total Assessment is a certain percentage of the fair market value that is determined by local assessors to be the total taxable value of land and additions on the property. | Land | Improvement |
|---|---|---|---|---|
| 2024 | $6,341 | $98,400 | $58,860 | $39,540 |
| 2023 | $6,341 | $98,400 | $58,860 | $39,540 |
| 2022 | $5,902 | $75,690 | $45,280 | $30,410 |
| 2021 | $8,816 | $113,470 | $45,280 | $68,190 |
| 2020 | $8,792 | $113,470 | $45,280 | $68,190 |
| 2019 | $5,144 | $60,550 | $21,260 | $39,290 |
| 2018 | $5,153 | $60,550 | $21,260 | $39,290 |
| 2017 | $5,119 | $60,550 | $21,260 | $39,290 |
| 2016 | $4,821 | $55,880 | $22,380 | $33,500 |
| 2015 | $4,573 | $55,880 | $22,380 | $33,500 |
| 2014 | $4,573 | $55,880 | $22,380 | $33,500 |
| 2012 | -- | $94,880 | $37,730 | $57,150 |
Source: Public Records
Map
Nearby Homes
- 1237 Old Springfield Rd
- 925 Old Springfield Rd
- 182 Preakness Ct
- 212 Triple Crown Dr
- 0 Old Springfield Rd
- 10515 Kley Rd
- 671 Martindale Rd
- 7585 Peters Rd
- 8202 Cherry Birch Dr
- 1111 Lightner Rd
- 9237 Dog Leg Rd
- 6980 S Karns Rd
- 411 N Main St
- 5265 W Frederick Garland Rd
- 300 Carol Ln
- 308 Lang Ct
- 129 Phillipsburg Union Rd
- 106 Rebecca Cir
- 101 Rebecca Cir
- 1072 Pool Ave
- 1867 Old Springfield Rd
- 1795 Old Springfield Rd
- 0 Old Springfield Rd Unit 399131
- 0 Old Springfield Rd Unit 412924
- 0 Old Springfield Rd Unit 412926
- 0 Old Springfield Rd Unit 443200
- 0 Old Springfield Rd Unit 454525
- 0 Old Springfield Rd Unit 454523
- 0 Old Springfield Rd Unit 452178
- 0 Old Springfield Rd Unit 451287
- 0 Old Springfield Rd Unit 451286
- 0 Old Springfield Rd Unit 451282
- 0 Old Springfield Rd Unit 450811
- 0 Old Springfield Rd Unit 462662
- 0 Old Springfield Rd Unit 470786
- 0 Old Springfield Rd Unit 471081
- 0 Old Springfield Rd Unit 490023
- 0 Old Springfield Rd Unit 496863
- 0 Old Springfield Rd Unit 496797
- 0 Old Springfield Rd Unit 496796