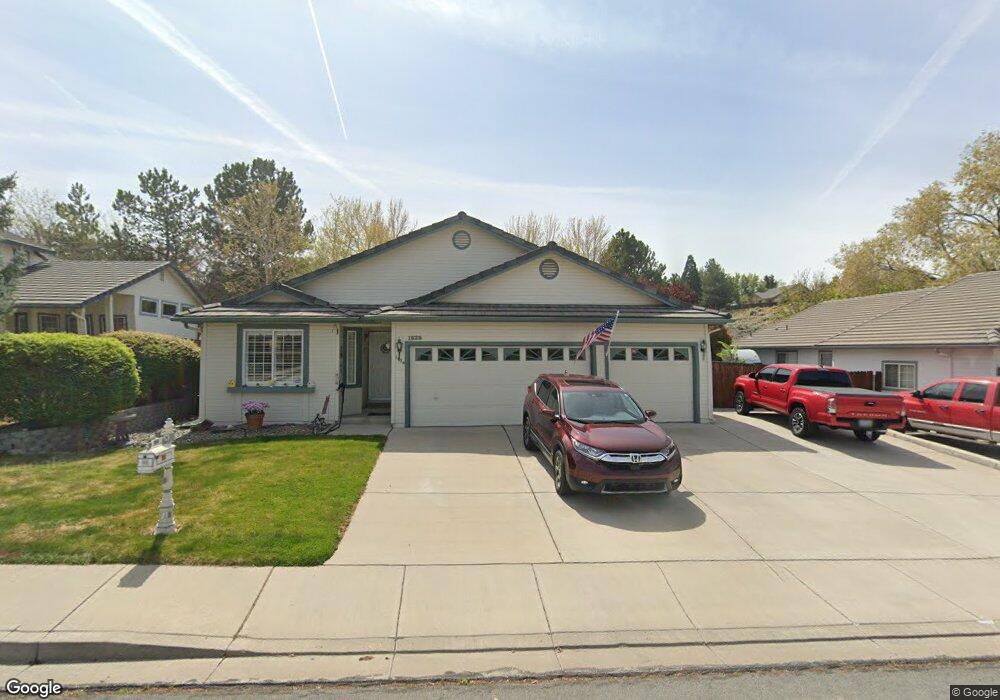
1825 Southview Dr Sparks, NV 89436
Los Altos Parkway NeighborhoodEstimated Value: $526,000 - $564,000
3
Beds
2
Baths
1,572
Sq Ft
$341/Sq Ft
Est. Value
About This Home
This home is located at 1825 Southview Dr, Sparks, NV 89436 and is currently estimated at $536,192, approximately $341 per square foot. 1825 Southview Dr is a home located in Washoe County with nearby schools including Bud Beasley Elementary School, Lou Mendive Middle School, and Edward C Reed High School.
Ownership History
Date
Name
Owned For
Owner Type
Purchase Details
Closed on
Apr 13, 2002
Sold by
Anderson Craig Stanley and Anderson Carolyn
Bought by
Anderson Craig Stanley and Anderson Carolyn
Current Estimated Value
Home Financials for this Owner
Home Financials are based on the most recent Mortgage that was taken out on this home.
Original Mortgage
$114,900
Interest Rate
6.87%
Purchase Details
Closed on
Oct 28, 1998
Sold by
Anderson Craig Stanley and Anderson Carolyn
Bought by
Anderson Craig Stanley and Anderson Carolyn
Purchase Details
Closed on
Jul 28, 1995
Sold by
Barker Homes Inc
Bought by
Anderson Craig S and Anderson Carolyn
Home Financials for this Owner
Home Financials are based on the most recent Mortgage that was taken out on this home.
Original Mortgage
$125,900
Interest Rate
7.62%
Create a Home Valuation Report for This Property
The Home Valuation Report is an in-depth analysis detailing your home's value as well as a comparison with similar homes in the area
Home Values in the Area
Average Home Value in this Area
Purchase History
| Date | Buyer | Sale Price | Title Company |
|---|---|---|---|
| Anderson Craig Stanley | $150,000 | Western Title Inc | |
| Anderson Craig Stanley | $150,000 | Western Title Company Inc | |
| Anderson Craig Stanley | -- | -- | |
| Anderson Craig S | $157,500 | Stewart Title |
Source: Public Records
Mortgage History
| Date | Status | Borrower | Loan Amount |
|---|---|---|---|
| Closed | Anderson Craig Stanley | $114,900 | |
| Closed | Anderson Craig S | $125,900 |
Source: Public Records
Tax History Compared to Growth
Tax History
| Year | Tax Paid | Tax Assessment Tax Assessment Total Assessment is a certain percentage of the fair market value that is determined by local assessors to be the total taxable value of land and additions on the property. | Land | Improvement |
|---|---|---|---|---|
| 2025 | $2,482 | $101,354 | $42,560 | $58,794 |
| 2024 | $2,482 | $99,565 | $40,075 | $59,490 |
| 2023 | $2,411 | $95,231 | $38,710 | $56,521 |
| 2022 | $1,750 | $80,201 | $32,830 | $47,371 |
| 2021 | $2,276 | $71,158 | $23,835 | $47,323 |
| 2020 | $2,206 | $71,406 | $23,800 | $47,606 |
| 2019 | $2,142 | $70,017 | $24,360 | $45,657 |
| 2018 | $2,080 | $62,609 | $17,780 | $44,829 |
| 2017 | $2,006 | $61,509 | $16,450 | $45,059 |
| 2016 | $1,967 | $60,681 | $14,525 | $46,156 |
| 2015 | $496 | $59,062 | $12,880 | $46,182 |
| 2014 | $1,906 | $55,658 | $10,885 | $44,773 |
| 2013 | -- | $48,954 | $8,925 | $40,029 |
Source: Public Records
Map
Nearby Homes
- 4670 High Desert Ct
- 1685 Southview Dr
- 1850 Almonte Ct
- 1560 Freeman Way
- 4675 Firtree Ln
- 1550 Istrice Rd
- 4383 Setting Sun Ct Unit 1
- 4601 N Cactus Hills Ct
- 1716 Canyon Terrace Dr
- 4393 Acobat Ct
- 5436 Vista Terrace Ln Unit 2B
- 5276 Santa Rosa Ave
- 2738 Kettle Ct
- 1484 Serendipity Ct
- 1388 Lambrays Ln
- 1557 Satellite Dr
- 5105 Santa Anita Dr
- 4677 High Pass Ct
- 4797 High Pass Dr
- 1475 Golddust Dr
- 1845 Southview Dr
- 1805 Southview Dr
- 2070 Canyon Vista Ct
- 2060 Canyon Vista Ct
- 1865 Southview Dr
- 4802 Blue Mountain Cir
- 1795 Southview Dr
- 2080 Canyon Vista Ct
- 1850 Southview Dr
- 1875 Southview Dr
- 2050 Canyon Vista Ct
- 2090 Canyon Vista Ct
- 1870 Southview Dr
- 1870 Southview Dr Unit NV
- 1790 Southview Dr
- 4810 Blue Mountain Cir
- 1791 Southview Dr
- 1880 Southview Dr
- 2065 Canyon Vista Ct
- 1897 Southview Dr