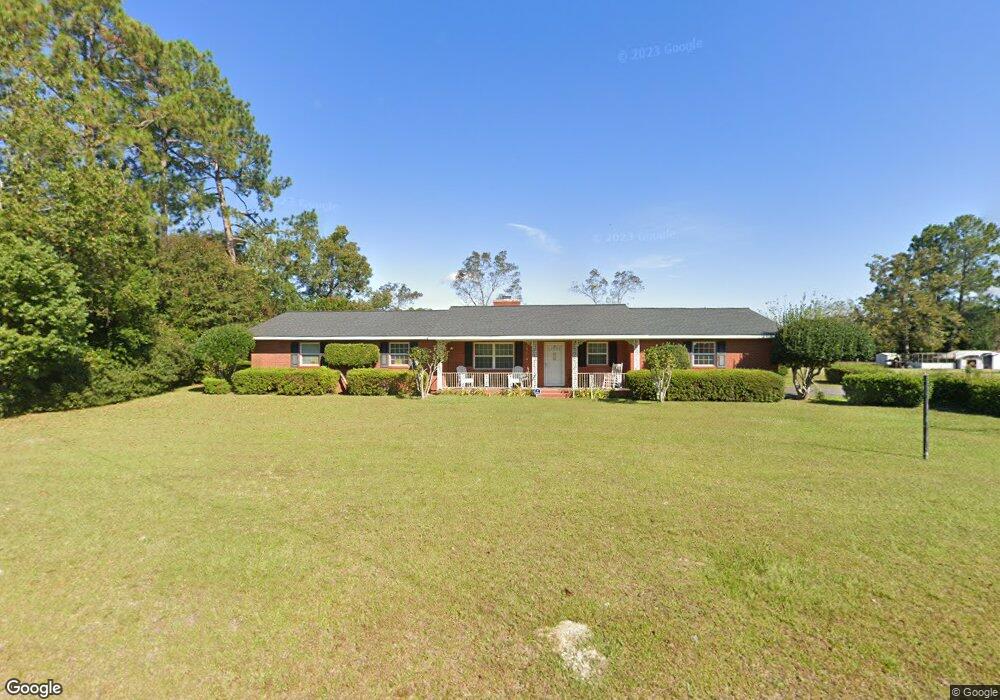
1826 Blalock Ave Waycross, GA 31503
Estimated Value: $231,326 - $313,000
--
Bed
2
Baths
1,710
Sq Ft
$157/Sq Ft
Est. Value
About This Home
This home is located at 1826 Blalock Ave, Waycross, GA 31503 and is currently estimated at $268,832, approximately $157 per square foot. 1826 Blalock Ave is a home located in Ware County with nearby schools including Wacona Elementary School, Ware County Middle School, and Ware County High School.
Ownership History
Date
Name
Owned For
Owner Type
Purchase Details
Closed on
Apr 17, 2023
Sold by
Gregory George B
Bought by
Gregory George B and Gregory Janice E
Current Estimated Value
Purchase Details
Closed on
Mar 21, 2017
Sold by
Rowell Tina Marie Highsmit
Bought by
Gregory George B and Gregory Janice A
Purchase Details
Closed on
Nov 8, 2010
Sold by
Onela Douglas Thomas Oneal and Onela Douglas
Bought by
Rowell William A
Purchase Details
Closed on
Jul 3, 2009
Sold by
Douglas Thomas Oneal
Bought by
Rowell William A
Home Financials for this Owner
Home Financials are based on the most recent Mortgage that was taken out on this home.
Original Mortgage
$126,663
Interest Rate
5.37%
Mortgage Type
FHA
Purchase Details
Closed on
Apr 22, 2009
Sold by
Douglas Carl Jefferson
Bought by
Douglas Thomas Oneal
Purchase Details
Closed on
Apr 8, 2009
Sold by
Douglas Thomas Oneal and Douglas Henry Jefferson
Bought by
Douglas Thomas Oneal and Douglas Carl Jefferson
Create a Home Valuation Report for This Property
The Home Valuation Report is an in-depth analysis detailing your home's value as well as a comparison with similar homes in the area
Home Values in the Area
Average Home Value in this Area
Purchase History
| Date | Buyer | Sale Price | Title Company |
|---|---|---|---|
| Gregory George B | -- | -- | |
| Gregory George B | $147,000 | -- | |
| Rowell William A | -- | -- | |
| Rowell William A | $129,000 | -- | |
| Douglas Thomas Oneal | -- | -- | |
| Douglas Thomas Oneal | -- | -- |
Source: Public Records
Mortgage History
| Date | Status | Borrower | Loan Amount |
|---|---|---|---|
| Previous Owner | Rowell William A | $126,663 |
Source: Public Records
Tax History Compared to Growth
Tax History
| Year | Tax Paid | Tax Assessment Tax Assessment Total Assessment is a certain percentage of the fair market value that is determined by local assessors to be the total taxable value of land and additions on the property. | Land | Improvement |
|---|---|---|---|---|
| 2024 | -- | $88,254 | $5,848 | $82,406 |
| 2023 | $0 | $75,758 | $11,800 | $63,958 |
| 2022 | $2,187 | $75,758 | $11,800 | $63,958 |
| 2021 | $2,033 | $64,875 | $11,800 | $53,075 |
| 2020 | $1,468 | $46,309 | $11,800 | $34,509 |
| 2019 | $1,472 | $45,514 | $11,800 | $33,714 |
| 2018 | $0 | $43,945 | $11,800 | $32,145 |
| 2017 | $1,368 | $43,945 | $11,800 | $32,145 |
| 2016 | $1,368 | $43,945 | $11,800 | $32,145 |
| 2015 | $1,380 | $43,944 | $11,800 | $32,145 |
| 2014 | $1,378 | $43,945 | $11,800 | $32,145 |
| 2013 | -- | $43,944 | $11,800 | $32,144 |
Source: Public Records
Map
Nearby Homes
- 3860 Blalock Ave
- 3648 Tanner Ln
- 1621 Meadowood Dr
- 3825 Jamestown Rd
- 1691 Huckaby Rd
- 123 Winn Clay Dr
- 4190 Church Street Extension
- 06 Alton Cir
- 03 Alton Cir
- 02 Alton Cir
- 04 Alton Cir
- 01 Alton Cir
- 2508 Mesa Rd
- Tract 2,3 Stetson Dr
- 2885 Ben St
- 2879 Ben St
- 0 Ash Dr
- 2869 Ben St
- 110 Briarwood Rd
- 221 Sierra Ln
- 3724 Benny St
- 1816 Blalock Ave
- 000 Blalock Ave
- 0000 Blalock Ave
- 1837 Blalock Ave
- 1837 Blalock Ave
- 3744 Benny St
- 1806 Blalock Ave
- 1807 Blalock Ave
- 1853 Blalock Ave
- 3764 Benny St
- 3751 Benny St
- 1851 Blalock Ave
- 1796 Blalock Ave
- 3779 Benny St
- 3609 Tanner Ln
- 1780 Meadowood Dr
- 1765 Blalock Ave
- 1765 Blalock Ave
- 3724 Lucile St