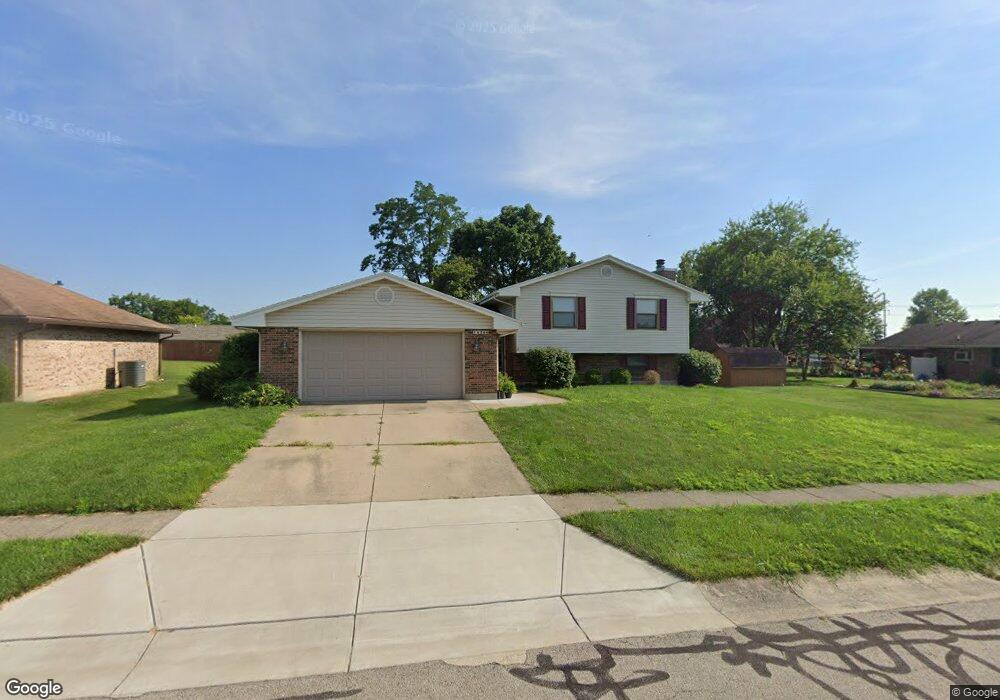
1826 Cudgell Dr Miamisburg, OH 45342
Estimated Value: $315,072 - $329,000
3
Beds
3
Baths
2,317
Sq Ft
$139/Sq Ft
Est. Value
About This Home
This home is located at 1826 Cudgell Dr, Miamisburg, OH 45342 and is currently estimated at $322,018, approximately $138 per square foot. 1826 Cudgell Dr is a home located in Montgomery County with nearby schools including Miamisburg High School and Bethel Baptist School.
Ownership History
Date
Name
Owned For
Owner Type
Purchase Details
Closed on
May 28, 2013
Sold by
Doughman Tracey and Lee Tracey
Bought by
Cristofaro Alexander S and Cristofaro Amber D
Current Estimated Value
Home Financials for this Owner
Home Financials are based on the most recent Mortgage that was taken out on this home.
Original Mortgage
$126,600
Outstanding Balance
$89,613
Interest Rate
3.38%
Mortgage Type
Future Advance Clause Open End Mortgage
Estimated Equity
$232,405
Purchase Details
Closed on
Jul 27, 2009
Sold by
Wellner Lawrence A and Wellner Debra L
Bought by
Lee Tracey
Home Financials for this Owner
Home Financials are based on the most recent Mortgage that was taken out on this home.
Original Mortgage
$152,192
Interest Rate
5.43%
Mortgage Type
FHA
Purchase Details
Closed on
Mar 31, 1994
Sold by
Warrington John Albert and Warrington Karen Eshbaugh
Bought by
Wellner Lawrence A and Wellner Debra L
Create a Home Valuation Report for This Property
The Home Valuation Report is an in-depth analysis detailing your home's value as well as a comparison with similar homes in the area
Home Values in the Area
Average Home Value in this Area
Purchase History
| Date | Buyer | Sale Price | Title Company |
|---|---|---|---|
| Cristofaro Alexander S | $158,300 | Gw Land Title Ltd | |
| Lee Tracey | $155,000 | Attorney | |
| Wellner Lawrence A | -- | -- |
Source: Public Records
Mortgage History
| Date | Status | Borrower | Loan Amount |
|---|---|---|---|
| Open | Cristofaro Alexander S | $126,600 | |
| Closed | Lee Tracey | $152,192 |
Source: Public Records
Tax History Compared to Growth
Tax History
| Year | Tax Paid | Tax Assessment Tax Assessment Total Assessment is a certain percentage of the fair market value that is determined by local assessors to be the total taxable value of land and additions on the property. | Land | Improvement |
|---|---|---|---|---|
| 2024 | $5,141 | $81,040 | $14,490 | $66,550 |
| 2023 | $5,141 | $81,040 | $14,490 | $66,550 |
| 2022 | $5,083 | $67,540 | $12,080 | $55,460 |
| 2021 | $4,495 | $67,540 | $12,080 | $55,460 |
| 2020 | $4,487 | $67,540 | $12,080 | $55,460 |
| 2019 | $3,987 | $55,070 | $10,500 | $44,570 |
| 2018 | $4,000 | $55,070 | $10,500 | $44,570 |
| 2017 | $3,973 | $55,070 | $10,500 | $44,570 |
| 2016 | $3,672 | $49,040 | $10,500 | $38,540 |
| 2015 | $3,600 | $49,040 | $10,500 | $38,540 |
| 2014 | $3,600 | $49,040 | $10,500 | $38,540 |
| 2012 | -- | $50,120 | $13,300 | $36,820 |
Source: Public Records
Map
Nearby Homes
- 1803 Cudgell Dr
- 838 Maid Marion Ct
- 857 Lea Castle Place
- 2125 Sherwood Forest Dr
- 429 Wilson Park Dr
- 2302 King Richard Pkwy
- 700 N Gebhart Church Rd
- 1109 Sundance Dr
- 1000 Skyview Dr
- 1100 S Elm St
- 703 Friar Tuck Ct
- 524 N Lindsey Ave
- 00 Heincke Rd
- 722 Peach Orchard Dr
- 257 Ironwood Dr
- 609 Kings Cross Ct
- 2061 Pine Forest Dr
- 250 Grantwood Dr
- 1232 Hollyhill Dr
- 516 N Lindsey Ave
- 1836 Cudgell Dr
- 1120 Kirkley Hall Dr
- 1811 Sherwood Forest Dr
- 1821 Sherwood Forest Dr
- 1823 Cudgel Dr
- 1102 Kirkley Hall Dr
- 1902 Cudgell Dr
- 1901 Sherwood Forest Dr
- 1823 Cudgell Dr
- 1831 Cudgell Dr
- 1911 Sherwood Forest Dr
- 1901 Cudgell Dr
- 1906 Cudgell Dr
- 1115 Kirkley Hall Dr
- 1121 Kirkley Hall Dr
- 1812 Sherwood Forest Dr
- 1921 Sherwood Forest Dr
- 1103 Kirkley Hall Dr
- 2102 Sir Lockesley Dr
- 1201 Kirkley Hall Dr