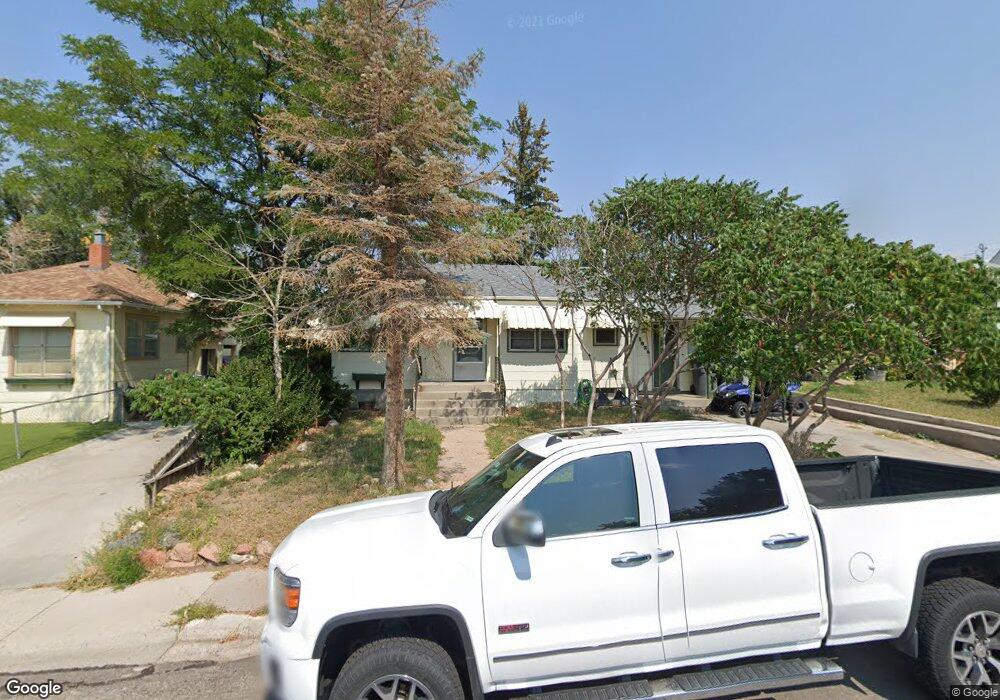
1826 E 18th St Cheyenne, WY 82001
Estimated Value: $277,000 - $308,000
4
Beds
2
Baths
1,768
Sq Ft
$169/Sq Ft
Est. Value
About This Home
This home is located at 1826 E 18th St, Cheyenne, WY 82001 and is currently estimated at $298,713, approximately $168 per square foot. 1826 E 18th St is a home located in Laramie County with nearby schools including Alta Vista Elementary School, Carey Junior High School, and East High School.
Ownership History
Date
Name
Owned For
Owner Type
Purchase Details
Closed on
Feb 22, 2018
Sold by
Deherrera Michelle A and Schroop Michelle
Bought by
Deherrera Michelle A
Current Estimated Value
Home Financials for this Owner
Home Financials are based on the most recent Mortgage that was taken out on this home.
Original Mortgage
$87,701
Outstanding Balance
$74,971
Interest Rate
4.37%
Mortgage Type
FHA
Estimated Equity
$223,742
Purchase Details
Closed on
Mar 31, 2009
Sold by
Morrow Douglas I and Morrow Robert J
Bought by
Schropp Michelle
Home Financials for this Owner
Home Financials are based on the most recent Mortgage that was taken out on this home.
Original Mortgage
$103,098
Interest Rate
5.14%
Mortgage Type
FHA
Purchase Details
Closed on
Nov 14, 2007
Sold by
Morrow Betty J
Bought by
Morrow Douglas I and Morrow Robert J
Create a Home Valuation Report for This Property
The Home Valuation Report is an in-depth analysis detailing your home's value as well as a comparison with similar homes in the area
Purchase History
| Date | Buyer | Sale Price | Title Company |
|---|---|---|---|
| Deherrera Michelle A | -- | First American Title | |
| Schropp Michelle | -- | None Available | |
| Morrow Douglas I | -- | None Available |
Source: Public Records
Mortgage History
| Date | Status | Borrower | Loan Amount |
|---|---|---|---|
| Open | Deherrera Michelle A | $87,701 | |
| Closed | Schropp Michelle | $103,098 |
Source: Public Records
Tax History
| Year | Tax Paid | Tax Assessment Tax Assessment Total Assessment is a certain percentage of the fair market value that is determined by local assessors to be the total taxable value of land and additions on the property. | Land | Improvement |
|---|---|---|---|---|
| 2025 | $1,839 | $19,668 | $2,501 | $17,167 |
| 2024 | $1,839 | $26,014 | $3,335 | $22,679 |
| 2023 | $1,793 | $25,355 | $3,335 | $22,020 |
| 2022 | $1,652 | $22,883 | $3,335 | $19,548 |
| 2021 | $1,399 | $19,343 | $3,335 | $16,008 |
| 2020 | $1,290 | $17,886 | $3,335 | $14,551 |
| 2019 | $1,250 | $17,316 | $3,335 | $13,981 |
| 2018 | $1,090 | $15,239 | $2,516 | $12,723 |
| 2017 | $1,059 | $14,674 | $2,516 | $12,158 |
| 2016 | $1,011 | $13,996 | $2,431 | $11,565 |
| 2015 | $977 | $13,526 | $2,431 | $11,095 |
| 2014 | $977 | $13,444 | $2,431 | $11,013 |
Source: Public Records
Map
Nearby Homes
- 1902 Cheyenne Place
- 1813 E 19th St
- TBD Charles St
- 1911 E 17th St
- 2008 E 17th St
- 2111 Garrett St
- 1910 E 22nd St
- 1851 E Pershing Blvd
- 1605 E 16th St
- 2123 E 18th St
- 1907 E Pershing Blvd
- 1608 E 21st St
- 1410 E 17th St
- 1406 E 19th St
- 1410 Carbon Ave Unit A-D
- 2013 Dunn Ave
- 1717 Alexander Ave Unit 302
- 1841 Crook Ave
- 2314 E 15th St
- 3520 Essex Rd
- 1822 E 18th St
- 1830 E 18th St
- 1818 E 18th St
- 1834 E 18th St
- 1817 Cheyenne Place
- 1819 Cheyenne Place
- 1815 Cheyenne Place
- Lot 9 Farthing Rd
- LOTS 2-5 Fusselman Ave
- 1814 E 18th St
- 1838 E 18th St
- 1821 Cheyenne Place
- Lot 8 E Phipps Ave
- Lot 3 E Phipps Ave
- Lot 4 E Phipps Ave
- Lot 12 E Phipps Ave
- Lot 14 E Phipps Ave
- Lot 2 E Phipps Ave
- Lot 7 E Phipps Ave
- Lot 6 E Phipps Ave
Your Personal Tour Guide
Ask me questions while you tour the home.