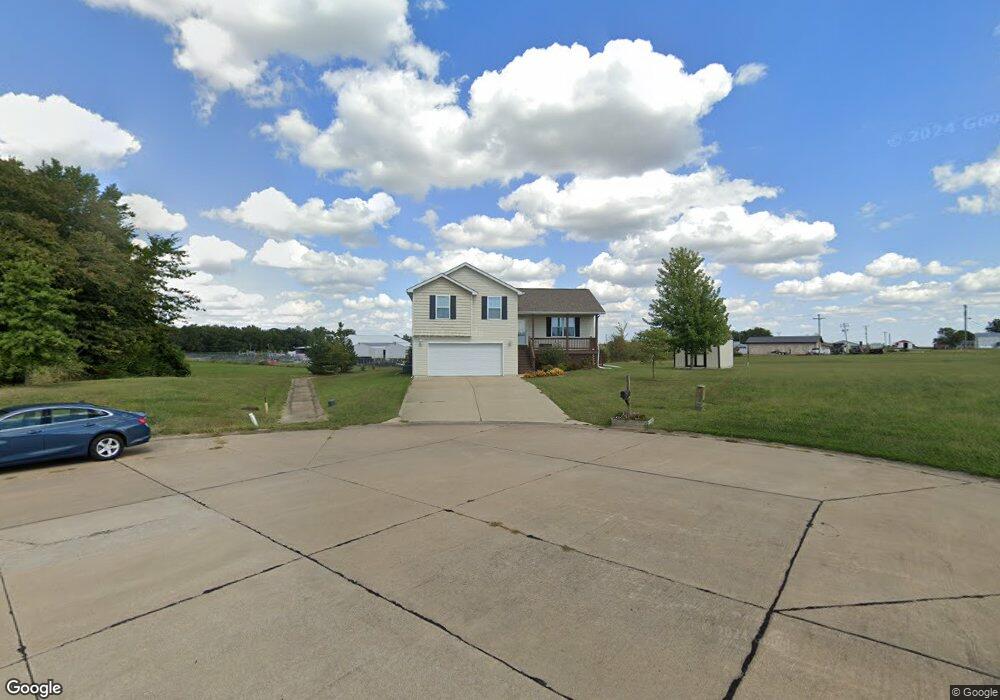
1826 Jenna Ct Sparta, IL 62286
Estimated Value: $187,000 - $295,000
3
Beds
3
Baths
1,746
Sq Ft
$137/Sq Ft
Est. Value
About This Home
This home is located at 1826 Jenna Ct, Sparta, IL 62286 and is currently estimated at $239,716, approximately $137 per square foot. 1826 Jenna Ct is a home located in Randolph County with nearby schools including Sparta High School.
Ownership History
Date
Name
Owned For
Owner Type
Purchase Details
Closed on
Aug 14, 2013
Sold by
Riverside Lawn Care Inc
Bought by
Innovation Construction Services Llc
Current Estimated Value
Home Financials for this Owner
Home Financials are based on the most recent Mortgage that was taken out on this home.
Original Mortgage
$128,000
Interest Rate
4.53%
Mortgage Type
Future Advance Clause Open End Mortgage
Create a Home Valuation Report for This Property
The Home Valuation Report is an in-depth analysis detailing your home's value as well as a comparison with similar homes in the area
Home Values in the Area
Average Home Value in this Area
Purchase History
We collect this data history from publicly available records. To have your information removed, we recommend requesting removal directly through your county’s website.
| Date | Buyer | Sale Price | Title Company |
|---|---|---|---|
| Innovation Construction Services Llc | $10,000 | None Available |
Source: Public Records
Mortgage History
We collect this data history from publicly available records. To have your information removed, we recommend requesting removal directly through your county’s website.
| Date | Status | Borrower | Loan Amount |
|---|---|---|---|
| Closed | Innovation Construction Services Llc | $128,000 |
Source: Public Records
Tax History
| Year | Tax Paid | Tax Assessment Tax Assessment Total Assessment is a certain percentage of the fair market value that is determined by local assessors to be the total taxable value of land and additions on the property. | Land | Improvement |
|---|---|---|---|---|
| 2024 | $5,549 | $64,500 | $6,780 | $57,720 |
| 2022 | $4,481 | $58,415 | $3,840 | $54,575 |
| 2021 | $4,659 | $55,120 | $3,625 | $51,495 |
| 2020 | $4,390 | $56,445 | $3,710 | $52,735 |
| 2019 | $4,282 | $50,520 | $3,320 | $47,200 |
| 2018 | $4,248 | $55,698 | $3,660 | $52,038 |
| 2017 | $3,619 | $50,975 | $3,350 | $47,625 |
| 2016 | $3,803 | $49,125 | $3,230 | $45,895 |
| 2015 | $282 | $49,125 | $3,230 | $45,895 |
| 2014 | $282 | $3,295 | $3,295 | $0 |
| 2013 | $31 | $380 | $380 | $0 |
Source: Public Records
Map
Nearby Homes
- 1739 Fieldcrest Dr
- 207 Sunset Dr
- 205 Marlynn Ct
- 151 W Doc Lin Dr
- 1117 Meadow Ln
- 1007 Hillcrest Dr
- 801 N James St
- 610 Spartan Dr
- 710 N Maple St
- 409 E Mound St
- 310 E Mound St
- 702 E Feifer St
- 714 E Feifer St
- 606 E College St
- 9324 Michael
- 408 E Main St
- 105 S Washington
- 540 E Broadway St
- 216 S Dickey St
- 410 S Saint Louis St
Your Personal Tour Guide
Ask me questions while you tour the home.