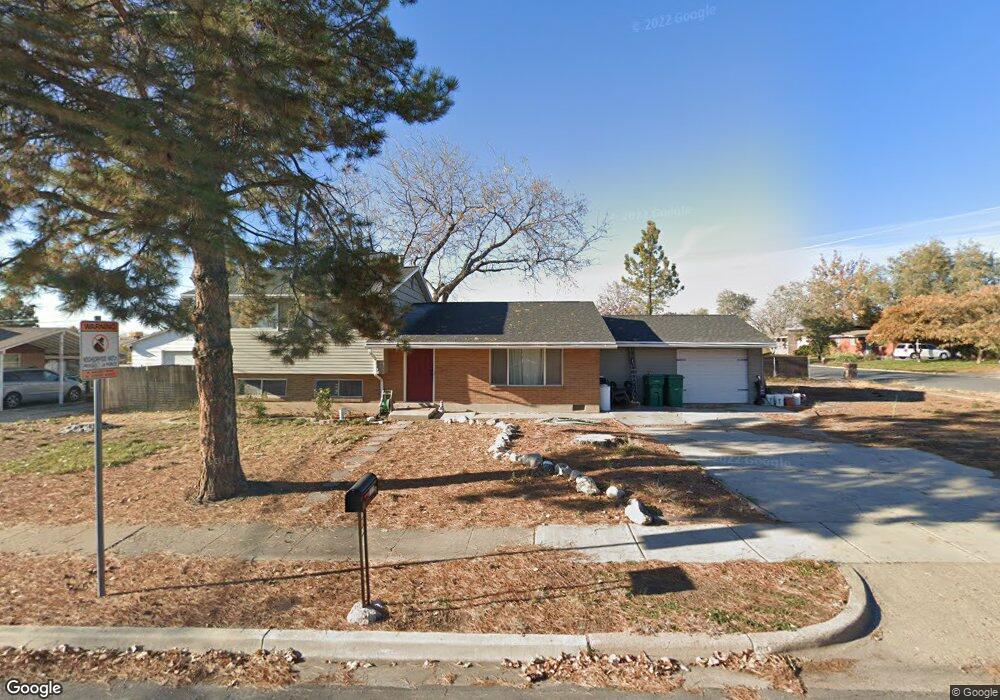
1826 John St Layton, UT 84041
Estimated Value: $407,000 - $428,000
4
Beds
2
Baths
1,678
Sq Ft
$248/Sq Ft
Est. Value
About This Home
This home is located at 1826 John St, Layton, UT 84041 and is currently estimated at $416,318, approximately $248 per square foot. 1826 John St is a home located in Davis County with nearby schools including Vae View Elementary School, Central Davis Junior High School, and Layton High School.
Ownership History
Date
Name
Owned For
Owner Type
Purchase Details
Closed on
Jan 18, 2019
Sold by
Svoboda Cory
Bought by
Svoboda Cory and Svoboda Karen A
Current Estimated Value
Home Financials for this Owner
Home Financials are based on the most recent Mortgage that was taken out on this home.
Original Mortgage
$89,000
Outstanding Balance
$78,249
Interest Rate
4.6%
Mortgage Type
New Conventional
Estimated Equity
$338,069
Purchase Details
Closed on
Jun 28, 2016
Sold by
Renewed Properties Llc
Bought by
Anema Jared N and Anema Meagan
Purchase Details
Closed on
Aug 12, 2009
Sold by
Palmer John
Bought by
Palmer John and Kulas Jennifer
Home Financials for this Owner
Home Financials are based on the most recent Mortgage that was taken out on this home.
Original Mortgage
$139,652
Interest Rate
5.3%
Mortgage Type
FHA
Purchase Details
Closed on
Feb 7, 2003
Sold by
Wadsworth Jeffrey N
Bought by
Done James A and Done Paula A
Create a Home Valuation Report for This Property
The Home Valuation Report is an in-depth analysis detailing your home's value as well as a comparison with similar homes in the area
Home Values in the Area
Average Home Value in this Area
Purchase History
| Date | Buyer | Sale Price | Title Company |
|---|---|---|---|
| Svoboda Cory | -- | Accommodation | |
| Svoboda Cory | -- | Vanguard Title Insurance Age | |
| Anema Jared N | -- | North American Title | |
| Palmer John | -- | Cottonwood Title Ins Agency | |
| Palmer John | -- | Hickman Land Title Co | |
| Done James A | -- | Bonneville Title Company Inc |
Source: Public Records
Mortgage History
| Date | Status | Borrower | Loan Amount |
|---|---|---|---|
| Open | Svoboda Cory | $89,000 | |
| Previous Owner | Palmer John | $139,652 |
Source: Public Records
Tax History
| Year | Tax Paid | Tax Assessment Tax Assessment Total Assessment is a certain percentage of the fair market value that is determined by local assessors to be the total taxable value of land and additions on the property. | Land | Improvement |
|---|---|---|---|---|
| 2025 | $2,112 | $221,650 | $99,966 | $121,684 |
| 2024 | $2,075 | $219,450 | $119,331 | $100,119 |
| 2023 | $1,985 | $370,000 | $154,597 | $215,403 |
| 2022 | $2,163 | $218,900 | $72,703 | $146,197 |
| 2021 | $1,968 | $297,000 | $103,727 | $193,273 |
| 2020 | $1,747 | $253,000 | $76,546 | $176,454 |
| 2019 | $1,615 | $229,000 | $73,604 | $155,396 |
| 2018 | $1,405 | $200,000 | $68,152 | $131,848 |
| 2016 | $937 | $68,806 | $19,498 | $49,308 |
| 2015 | $1,103 | $76,946 | $19,498 | $57,448 |
| 2014 | $1,090 | $77,734 | $19,498 | $58,236 |
| 2013 | -- | $71,827 | $19,646 | $52,181 |
Source: Public Records
Map
Nearby Homes
- 1847 John St
- 1896 Cliff Place
- 1744 Alfred Dr
- 1740 N Gregory Dr
- 1596 N Main St Unit 2
- 1648 W 1920 N
- 1707 N 1625 W
- 1713 N 1625 W
- 1916 N Celia Way
- 1650 N Main St Unit 126
- 1748 N 1600 W
- 1740 N 1600 W Unit 116
- 1696 N 1600 W Unit 123
- 1688 N 1600 W
- 1606 W 1960 N
- 1682 N 1600 W
- 1664 N 1600 W
- 1658 N 1600 St W Unit 130
- 1654 N 1600 W
- 1652 N 1600 St W
Your Personal Tour Guide
Ask me questions while you tour the home.