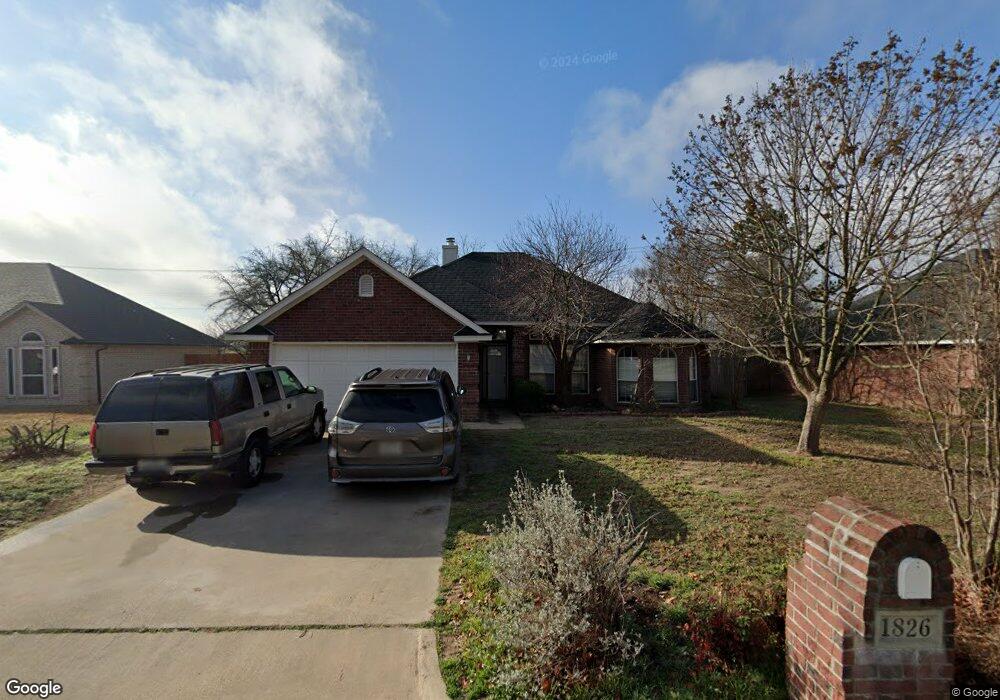
1826 Laura St Weatherford, TX 76086
Estimated Value: $289,552 - $314,000
3
Beds
2
Baths
1,483
Sq Ft
$202/Sq Ft
Est. Value
About This Home
This home is located at 1826 Laura St, Weatherford, TX 76086 and is currently estimated at $299,888, approximately $202 per square foot. 1826 Laura St is a home located in Parker County with nearby schools including Ikard Elementary School, Tison Middle School, and Weatherford High School.
Ownership History
Date
Name
Owned For
Owner Type
Purchase Details
Closed on
Jun 1, 2015
Sold by
Dickey Winfred L
Bought by
Kramer Thomas Lynn
Current Estimated Value
Home Financials for this Owner
Home Financials are based on the most recent Mortgage that was taken out on this home.
Original Mortgage
$141,550
Outstanding Balance
$109,360
Interest Rate
3.68%
Mortgage Type
New Conventional
Estimated Equity
$190,528
Purchase Details
Closed on
Jul 6, 2007
Sold by
Boyse Dennis and Boyse Esther
Bought by
Kramer Thomas Lynn
Home Financials for this Owner
Home Financials are based on the most recent Mortgage that was taken out on this home.
Original Mortgage
$74,500
Interest Rate
6.09%
Mortgage Type
New Conventional
Purchase Details
Closed on
Apr 25, 2001
Sold by
Weatherford Properties A Joint
Bought by
Kramer Thomas Lynn
Create a Home Valuation Report for This Property
The Home Valuation Report is an in-depth analysis detailing your home's value as well as a comparison with similar homes in the area
Home Values in the Area
Average Home Value in this Area
Purchase History
| Date | Buyer | Sale Price | Title Company |
|---|---|---|---|
| Kramer Thomas Lynn | -- | None Available | |
| Kramer Thomas Lynn | -- | -- | |
| Dickey Winfred L | -- | Laatc | |
| Kramer Thomas Lynn | -- | -- |
Source: Public Records
Mortgage History
| Date | Status | Borrower | Loan Amount |
|---|---|---|---|
| Open | Kramer Thomas Lynn | $141,550 | |
| Previous Owner | Dickey Winfred L | $74,500 |
Source: Public Records
Tax History Compared to Growth
Tax History
| Year | Tax Paid | Tax Assessment Tax Assessment Total Assessment is a certain percentage of the fair market value that is determined by local assessors to be the total taxable value of land and additions on the property. | Land | Improvement |
|---|---|---|---|---|
| 2025 | $4,110 | $293,679 | -- | -- |
| 2024 | $4,110 | $266,981 | -- | -- |
| 2023 | $4,110 | $242,710 | $0 | $0 |
| 2022 | $4,894 | $220,650 | $20,000 | $200,650 |
| 2021 | $5,299 | $220,650 | $20,000 | $200,650 |
| 2020 | $4,365 | $180,640 | $20,000 | $160,640 |
| 2019 | $4,613 | $180,640 | $20,000 | $160,640 |
| 2018 | $4,128 | $160,920 | $20,000 | $140,920 |
| 2017 | $4,234 | $160,920 | $20,000 | $140,920 |
| 2016 | $3,486 | $132,480 | $20,000 | $112,480 |
| 2015 | $3,044 | $132,480 | $20,000 | $112,480 |
| 2014 | -- | $120,900 | $20,000 | $100,900 |
Source: Public Records
Map
Nearby Homes
- Horseshoe Bend Rd
- 0 Adell Cir
- 905 Terry Trail
- 1917 Windowmere Trail
- 107 Hickory Ln
- 307 Hickory Ln
- 305 Hickory Ln
- The Chisholm Plan at Hickory Place Addition
- 509 Sweetwater Dr
- 214 Willow Creek Dr
- 522 Crow Ave
- 1609 Dicey Rd
- 228 Allen St
- 2004 Hill Crest Ct
- 2008 Hill Crest Ct
- 207 Camelot Dr
- 110 Pine St
- 936 Eldorado St
- 934 Eldorado St
- 2001 Santa fe Dr