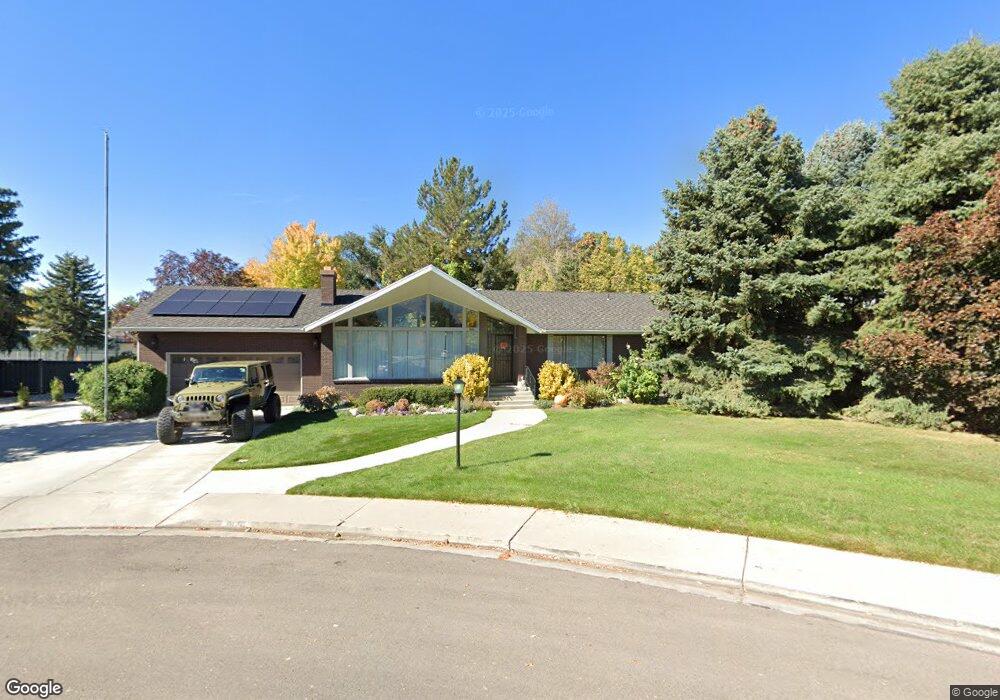
1826 S 140 E Orem, UT 84058
Cherry Hill NeighborhoodEstimated Value: $635,000 - $744,208
4
Beds
4
Baths
2,058
Sq Ft
$341/Sq Ft
Est. Value
About This Home
This home is located at 1826 S 140 E, Orem, UT 84058 and is currently estimated at $701,403, approximately $340 per square foot. 1826 S 140 E is a home located in Utah County with nearby schools including Cherry Hill Elementary School, Lakeridge Jr High School, and Mountain View High School.
Ownership History
Date
Name
Owned For
Owner Type
Purchase Details
Closed on
Dec 10, 2010
Sold by
Patch Robert Allen and Patch Brian Maeser
Bought by
Huntsman Trent C and Huntsman Adela K
Current Estimated Value
Home Financials for this Owner
Home Financials are based on the most recent Mortgage that was taken out on this home.
Original Mortgage
$256,500
Outstanding Balance
$169,119
Interest Rate
4.18%
Mortgage Type
New Conventional
Estimated Equity
$532,284
Purchase Details
Closed on
May 21, 2008
Sold by
Patch Robert C and Patch Adonna
Bought by
Patch Robert C and Patch Adonna A
Create a Home Valuation Report for This Property
The Home Valuation Report is an in-depth analysis detailing your home's value as well as a comparison with similar homes in the area
Home Values in the Area
Average Home Value in this Area
Purchase History
| Date | Buyer | Sale Price | Title Company |
|---|---|---|---|
| Huntsman Trent C | -- | Title West Orem | |
| Patch Robert C | -- | None Available |
Source: Public Records
Mortgage History
| Date | Status | Borrower | Loan Amount |
|---|---|---|---|
| Open | Huntsman Trent C | $256,500 |
Source: Public Records
Tax History
| Year | Tax Paid | Tax Assessment Tax Assessment Total Assessment is a certain percentage of the fair market value that is determined by local assessors to be the total taxable value of land and additions on the property. | Land | Improvement |
|---|---|---|---|---|
| 2025 | $2,996 | $391,380 | -- | -- |
| 2024 | $2,996 | $366,300 | $0 | $0 |
| 2023 | $2,802 | $368,280 | $0 | $0 |
| 2022 | $2,906 | $369,985 | $0 | $0 |
| 2021 | $2,827 | $545,200 | $250,600 | $294,600 |
| 2020 | $2,630 | $498,500 | $217,900 | $280,600 |
| 2019 | $2,344 | $461,900 | $217,900 | $244,000 |
| 2018 | $2,453 | $461,900 | $217,900 | $244,000 |
| 2017 | $1,912 | $192,885 | $0 | $0 |
| 2016 | $2,027 | $188,595 | $0 | $0 |
| 2015 | $2,041 | $179,575 | $0 | $0 |
| 2014 | $1,877 | $164,340 | $0 | $0 |
Source: Public Records
Map
Nearby Homes
Your Personal Tour Guide
Ask me questions while you tour the home.