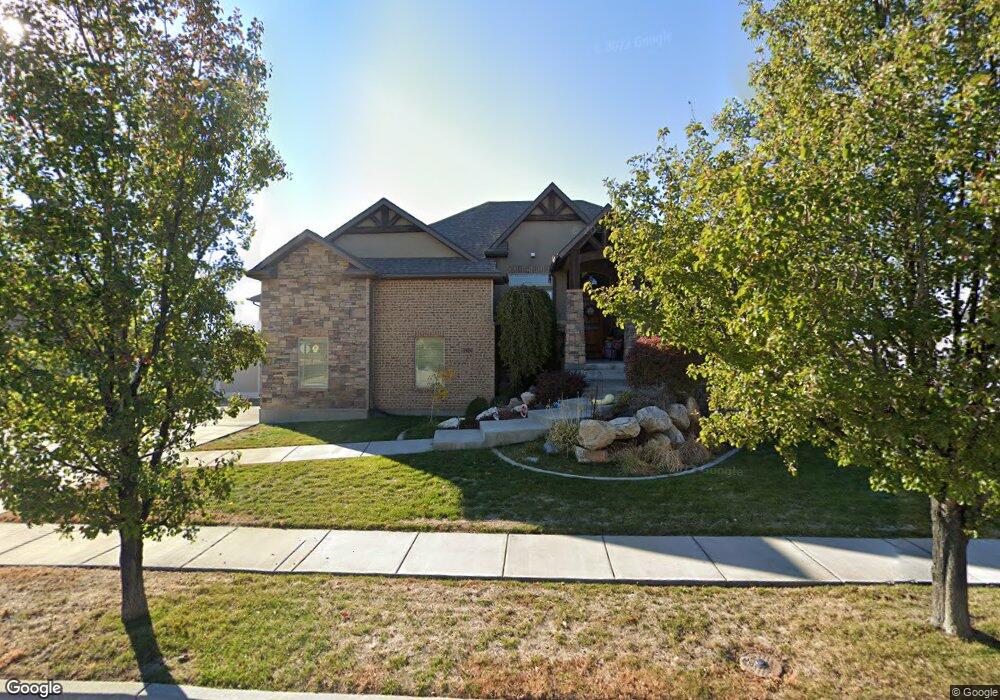
1826 S 3720 W Syracuse, UT 84075
Estimated Value: $753,000 - $807,306
6
Beds
4
Baths
4,132
Sq Ft
$188/Sq Ft
Est. Value
About This Home
This home is located at 1826 S 3720 W, Syracuse, UT 84075 and is currently estimated at $774,827, approximately $187 per square foot. 1826 S 3720 W is a home located in Davis County with nearby schools including Buffalo Point School, Syracuse Junior High School, and Syracuse High School.
Ownership History
Date
Name
Owned For
Owner Type
Purchase Details
Closed on
Sep 12, 2024
Sold by
Maki Jake and Maki Brittany
Bought by
Nguyen Kyle and Dinh Kelly
Current Estimated Value
Home Financials for this Owner
Home Financials are based on the most recent Mortgage that was taken out on this home.
Original Mortgage
$599,880
Outstanding Balance
$593,462
Interest Rate
6.73%
Mortgage Type
New Conventional
Estimated Equity
$181,365
Purchase Details
Closed on
Aug 19, 2016
Sold by
Tipton Amy Marie and Tipton Troy Eugene
Bought by
Maki Brittany and Maki Jake
Purchase Details
Closed on
Nov 26, 2007
Sold by
Nilson Homes Inc
Bought by
Tipton Amy Marie and Tipton Troy Eugene
Home Financials for this Owner
Home Financials are based on the most recent Mortgage that was taken out on this home.
Original Mortgage
$368,000
Interest Rate
6.3%
Mortgage Type
Construction
Purchase Details
Closed on
Jan 4, 2007
Sold by
Us Development Inc
Bought by
Nilson Homes Inc
Home Financials for this Owner
Home Financials are based on the most recent Mortgage that was taken out on this home.
Original Mortgage
$180,180
Interest Rate
6.12%
Mortgage Type
Purchase Money Mortgage
Create a Home Valuation Report for This Property
The Home Valuation Report is an in-depth analysis detailing your home's value as well as a comparison with similar homes in the area
Home Values in the Area
Average Home Value in this Area
Purchase History
| Date | Buyer | Sale Price | Title Company |
|---|---|---|---|
| Nguyen Kyle | -- | Freedom Title Insurance Agency | |
| Maki Brittany | -- | Backman Title | |
| Tipton Amy Marie | -- | Bonneville Superior Title Co | |
| Nilson Homes Inc | -- | Bonneville Superior Title Co |
Source: Public Records
Mortgage History
| Date | Status | Borrower | Loan Amount |
|---|---|---|---|
| Open | Nguyen Kyle | $599,880 | |
| Previous Owner | Tipton Amy Marie | $368,000 | |
| Previous Owner | Nilson Homes Inc | $180,180 |
Source: Public Records
Tax History Compared to Growth
Tax History
| Year | Tax Paid | Tax Assessment Tax Assessment Total Assessment is a certain percentage of the fair market value that is determined by local assessors to be the total taxable value of land and additions on the property. | Land | Improvement |
|---|---|---|---|---|
| 2024 | $4,128 | $400,950 | $94,322 | $306,628 |
| 2023 | $3,859 | $683,000 | $139,229 | $543,771 |
| 2022 | $4,093 | $397,100 | $71,792 | $325,308 |
| 2021 | $3,489 | $524,000 | $104,409 | $419,591 |
| 2020 | $3,253 | $473,000 | $86,460 | $386,540 |
| 2019 | $3,260 | $468,000 | $89,096 | $378,904 |
| 2018 | $3,004 | $428,000 | $85,948 | $342,052 |
| 2016 | $2,885 | $215,600 | $34,907 | $180,693 |
| 2015 | $3,245 | $230,945 | $34,907 | $196,038 |
| 2014 | $3,116 | $226,012 | $34,907 | $191,105 |
| 2013 | -- | $186,455 | $36,163 | $150,292 |
Source: Public Records
Map
Nearby Homes
- 3704 W 2170 S Unit 111
- 1569 Troon Cir
- 3564 Princeville Dr
- 3882 Turnberry Dr
- 1430 Heather Ln
- 2318 S 3450 W
- 3736 W 1225 S
- 1441 Brookshire Dr
- 3867 Rungsted Cir
- 3951 Baltimore Cir
- 3627 W Augusta Dr
- 1084 S 4090 W
- 1077 Spyglass Hill
- 4580 W 1700 S
- 1039 S 4250 W
- 895 Dunes Dr
- 1155 S 4475 W
- 1107 S 4475 W
- 3634 W 850 S
- 3661 W 800 S
- 1844 S 3720 W
- 1804 S 3720 W Unit 322
- 1827 S 3720 W
- 1862 S 3720 W
- 1801 S 3720 W Unit 313
- 1801 S 3720 W
- 1786 S 3720 W
- 1853 S 3720 W
- 1857 S 3720 W
- 1789 S 3720 W Unit 314
- 1789 S 3720 W
- 1884 S 3720 W
- 1768 S 3720 W Unit 320
- 3678 W 1840 S
- 1879 S 3720 W
- 1806 S 3660 W Unit 312
- 1761 S 3720 W Unit 315
- 1788 S 3660 W Unit 311
- 1902 S 3720 W
- 1746 S 3720 W Unit 319