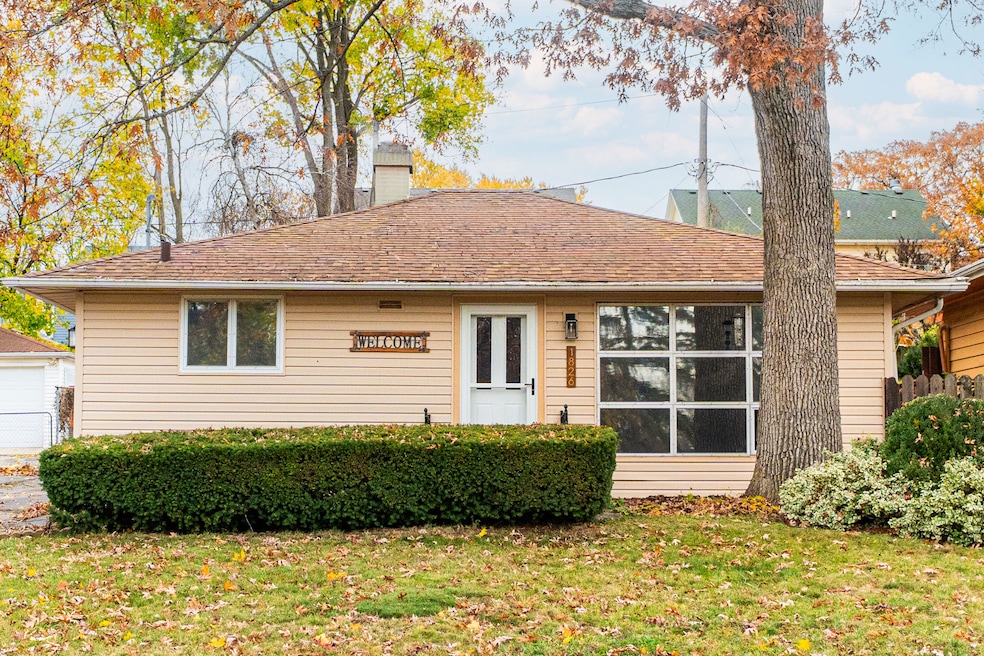
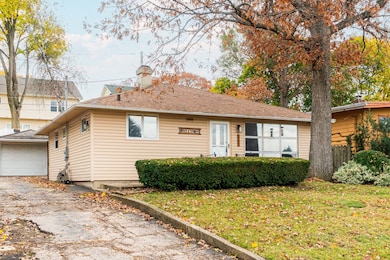
1826 S 3rd Place Saint Charles, IL 60174
Southeast Saint Charles NeighborhoodEstimated payment $1,904/month
Highlights
- Deck
- Property is near a park
- Porch
- Munhall Elementary School Rated A
- Ranch Style House
- 4-minute walk to Elm Park
About This Home
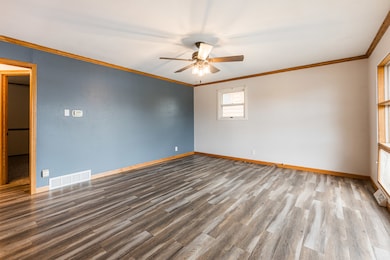
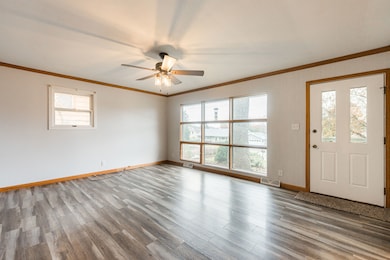
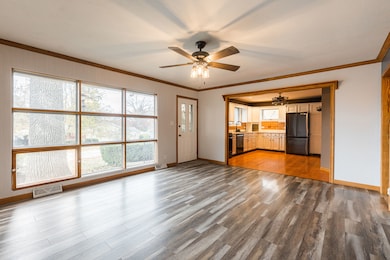
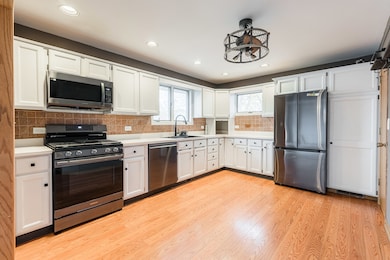
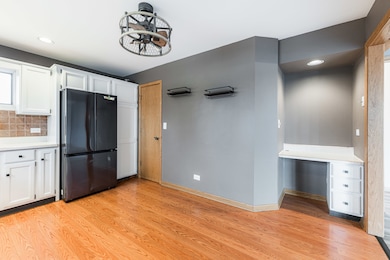
Cozy Ranch Home now available in St Charles! Walking distance to River, located on an Elevated, Established lot & street surrounded by Mature Trees, smack dab in between downtown St Charles and Geneva. Home features a Spacious Living Room with a front Wall of Windows letting in abundant Natural Light. Connects to open, eat-in Kitchen with plenty of Cabinets and Counter space, including a Built in Desk for work or recreational use. Primary Bedroom has Wood Beamed ceiling & built in double Wood Closets. 2nd Bedroom features another built in Wood Closet. Walk out to the Fenced in, Private Backyard to see the Comfortable, Relaxing Nature Sanctuary. Large private Deck with Gazebo to sit and enjoy the outdoors. Be sure to check out the "Secret Garden" Patio behind the garage for even more outdoor privacy. Detached Garage with an Attached Shed. Updates include newer Roof and Siding, newer Furnace, fresh interior Paint, new bedroom Carpet, new kitchen Appliances, and Light Fixtures. As they say, real estate is all about Location, Location, Location!! This one has it all! Come see it today and find your New Home.
Home Details
Home Type
- Single Family
Est. Annual Taxes
- $5,620
Year Built
- Built in 1954
Lot Details
- Lot Dimensions are 50x124
- Fenced
- Paved or Partially Paved Lot
Parking
- 1 Car Garage
- Driveway
Home Design
- Ranch Style House
- Asphalt Roof
- Concrete Perimeter Foundation
Interior Spaces
- 957 Sq Ft Home
- Ceiling Fan
- Family Room
- Living Room
- Dining Room
- Sump Pump
- Carbon Monoxide Detectors
Kitchen
- Range
- Microwave
- Dishwasher
Flooring
- Carpet
- Laminate
Bedrooms and Bathrooms
- 2 Bedrooms
- 2 Potential Bedrooms
- Bathroom on Main Level
- 1 Full Bathroom
- Soaking Tub
Laundry
- Laundry Room
- Dryer
- Washer
Outdoor Features
- Deck
- Patio
- Shed
- Pergola
- Porch
Location
- Property is near a park
Utilities
- Central Air
- Heating System Uses Natural Gas
- 100 Amp Service
Community Details
- Western Samaritan Subdivision
Listing and Financial Details
- Homeowner Tax Exemptions
Map
Home Values in the Area
Average Home Value in this Area
Tax History
| Year | Tax Paid | Tax Assessment Tax Assessment Total Assessment is a certain percentage of the fair market value that is determined by local assessors to be the total taxable value of land and additions on the property. | Land | Improvement |
|---|---|---|---|---|
| 2024 | $5,620 | $75,710 | $27,930 | $47,780 |
| 2023 | $5,423 | $67,762 | $24,998 | $42,764 |
| 2022 | $5,014 | $62,105 | $23,980 | $38,125 |
| 2021 | $4,828 | $59,199 | $22,858 | $36,341 |
| 2020 | $4,781 | $58,095 | $22,432 | $35,663 |
| 2019 | $4,549 | $55,121 | $21,988 | $33,133 |
| 2018 | $4,299 | $51,829 | $21,151 | $30,678 |
| 2017 | $3,692 | $50,057 | $20,428 | $29,629 |
| 2016 | $3,864 | $48,299 | $19,711 | $28,588 |
| 2015 | -- | $46,807 | $19,498 | $27,309 |
| 2014 | -- | $47,738 | $19,498 | $28,240 |
| 2013 | -- | $48,727 | $19,693 | $29,034 |
Property History
| Date | Event | Price | List to Sale | Price per Sq Ft | Prior Sale |
|---|---|---|---|---|---|
| 11/14/2025 11/14/25 | Pending | -- | -- | -- | |
| 11/13/2025 11/13/25 | For Sale | $272,500 | +60.3% | $285 / Sq Ft | |
| 01/07/2018 01/07/18 | Off Market | $170,000 | -- | -- | |
| 10/09/2017 10/09/17 | Sold | $170,000 | -2.6% | $178 / Sq Ft | View Prior Sale |
| 08/24/2017 08/24/17 | Pending | -- | -- | -- | |
| 08/17/2017 08/17/17 | For Sale | $174,500 | -- | $182 / Sq Ft |
Purchase History
| Date | Type | Sale Price | Title Company |
|---|---|---|---|
| Warranty Deed | $172,500 | None Available | |
| Interfamily Deed Transfer | -- | Advanced Title Services Inc | |
| Warranty Deed | $80,666 | Advanced Title Services Inc |
Mortgage History
| Date | Status | Loan Amount | Loan Type |
|---|---|---|---|
| Open | $168,459 | FHA | |
| Previous Owner | $116,824 | FHA | |
| Previous Owner | $119,837 | FHA |
Source: Midwest Real Estate Data (MRED)
MLS Number: 12516509
APN: 09-35-358-006
Disclaimer: Certain information contained herein is derived from information provided by parties other than Homes.com. All information provided is deemed reliable, but is not guaranteed to be accurate and should be independently verified.
![]() Based on information submitted to the MLS GRID. All data is obtained from various sources and may not have been verified by broker or MLS GRID. Supplied Open House Information is subject to change without notice. All information should be independently reviewed and verified for accuracy. Properties may or may not be listed by the office/agent presenting the information. Some IDX listings have been excluded from this website.
Based on information submitted to the MLS GRID. All data is obtained from various sources and may not have been verified by broker or MLS GRID. Supplied Open House Information is subject to change without notice. All information should be independently reviewed and verified for accuracy. Properties may or may not be listed by the office/agent presenting the information. Some IDX listings have been excluded from this website.
The Digital Millennium Copyright Act of 1998, 17 U.S.C. § 512 (the “DMCA”) provides recourse for copyright owners who believe that material appearing on the Internet infringes their rights under U.S. copyright law. If you believe in good faith that any content or material made available in connection with our website or services infringes your copyright, you (or your agent) may send us a notice requesting that the content or material be removed, or access to it blocked.
Notices must be sent in writing by email to DMCAnotice@MLSGrid.com.
The DMCA requires that your notice of alleged copyright infringement include the following information:
(1) description of the copyrighted work that is the subject of claimed infringement;
(2) description of the alleged infringing content and information sufficient to permit us to locate the content;
(3) contact information for you, including your address, telephone number and email address;
(4) a statement by you that you have a good faith belief that the content in the manner complained of is not authorized by the copyright owner, or its agent, or by the operation of any law;
(5) a statement by you, signed under penalty of perjury, that the information in the notification is accurate and that you have the authority to enforce the copyrights that are claimed to be infringed; and
(6) a physical or electronic signature of the copyright owner or a person authorized to act on the copyright owner’s behalf. Failure to include all of the above information may result in the delay of the processing of your complaint.
- 304 Moore Ave
- 1719 S 4th Place
- 839 N Bennett St
- 1807 Forrest Blvd
- 702 E Side Dr
- 1905 Forrest Blvd
- 1441 Walnut Hill Ave
- 1464 Division Ct
- Lot 2 Geneva Rd
- Lot 1 Geneva Rd
- 888 Geneva Dr
- 1008 Pine St
- LOT 209 Austin Ave
- 10 Ford St Unit 103
- 501 Dodson St
- Lot 1 Keller Place
- 202 N Bennett St
- 1533 Banbury Ave
- 885 Geneva Rd
- 82 Gray St
