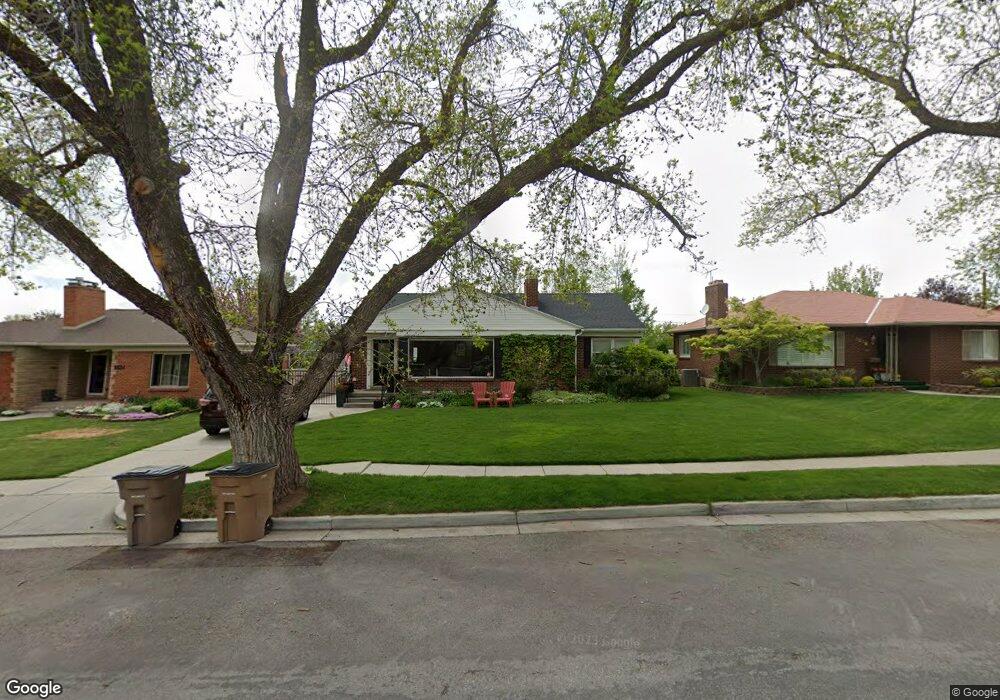
1826 S Nevada St Salt Lake City, UT 84108
Sugar House NeighborhoodEstimated Value: $805,000 - $978,000
5
Beds
2
Baths
2,684
Sq Ft
$339/Sq Ft
Est. Value
About This Home
This home is located at 1826 S Nevada St, Salt Lake City, UT 84108 and is currently estimated at $908,862, approximately $338 per square foot. 1826 S Nevada St is a home located in Salt Lake County with nearby schools including Beacon Heights School, Hillside Middle School, and Highland High School.
Ownership History
Date
Name
Owned For
Owner Type
Purchase Details
Closed on
Jun 25, 2020
Sold by
Benseler Andrew Scott
Bought by
Benseler Andrew and Benseler Jacqueline Moira
Current Estimated Value
Home Financials for this Owner
Home Financials are based on the most recent Mortgage that was taken out on this home.
Original Mortgage
$349,700
Outstanding Balance
$310,666
Interest Rate
3.2%
Mortgage Type
New Conventional
Estimated Equity
$598,196
Purchase Details
Closed on
Aug 29, 2016
Sold by
Benseler Andrew
Bought by
Benseler Andrew and Benseler Jacqueline Moira
Home Financials for this Owner
Home Financials are based on the most recent Mortgage that was taken out on this home.
Original Mortgage
$369,600
Interest Rate
3.42%
Mortgage Type
New Conventional
Purchase Details
Closed on
Jun 3, 2011
Sold by
Vaas Jonathan
Bought by
Vaas Jonathan and Facelli Julie Anna
Home Financials for this Owner
Home Financials are based on the most recent Mortgage that was taken out on this home.
Original Mortgage
$171,900
Interest Rate
3.95%
Mortgage Type
New Conventional
Purchase Details
Closed on
Jun 2, 2011
Sold by
Pant Gautam and Pant Shagun
Bought by
Vaas Jonathan
Home Financials for this Owner
Home Financials are based on the most recent Mortgage that was taken out on this home.
Original Mortgage
$171,900
Interest Rate
3.95%
Mortgage Type
New Conventional
Purchase Details
Closed on
Jul 15, 2005
Sold by
Johnson Deonne B
Bought by
Pant Gautam and Pant Shagun
Home Financials for this Owner
Home Financials are based on the most recent Mortgage that was taken out on this home.
Original Mortgage
$286,000
Interest Rate
5.37%
Mortgage Type
Fannie Mae Freddie Mac
Purchase Details
Closed on
Jan 28, 2003
Sold by
Heyn Robert D and Heyn Paula J
Bought by
Johnson Deonne B
Home Financials for this Owner
Home Financials are based on the most recent Mortgage that was taken out on this home.
Original Mortgage
$240,450
Interest Rate
5.97%
Purchase Details
Closed on
Oct 3, 2001
Sold by
Moomber Michael C and Moomber Michele A
Bought by
Heyn Robert D and Heyn Paula J
Home Financials for this Owner
Home Financials are based on the most recent Mortgage that was taken out on this home.
Original Mortgage
$220,000
Interest Rate
6.9%
Purchase Details
Closed on
Jun 8, 2001
Sold by
Anderson John Kevin
Bought by
Mcomber Michael C and Mcomber Michele A
Home Financials for this Owner
Home Financials are based on the most recent Mortgage that was taken out on this home.
Original Mortgage
$92,393
Interest Rate
7.14%
Purchase Details
Closed on
Jul 3, 1996
Sold by
Anderson John E and Anderson Doy K
Bought by
Anderson John Emmert and Anderson Doy Kingsford
Create a Home Valuation Report for This Property
The Home Valuation Report is an in-depth analysis detailing your home's value as well as a comparison with similar homes in the area
Home Values in the Area
Average Home Value in this Area
Purchase History
| Date | Buyer | Sale Price | Title Company |
|---|---|---|---|
| Benseler Andrew | -- | Accommodation | |
| Benseler Andrew Scott | -- | Backman Title Services | |
| Benseler Andrew | -- | None Available | |
| Benseler Acrnew | -- | Landmark Title | |
| Vaas Jonathan | -- | Accommodation | |
| Vaas Jonathan | -- | Equity Title | |
| Pant Gautam | -- | Landmark Title | |
| Johnson Deonne B | -- | Guardian Title | |
| Heyn Robert D | -- | Guardian Title | |
| Mcomber Michael C | -- | Meridian Title | |
| Anderson John Emmert | -- | -- |
Source: Public Records
Mortgage History
| Date | Status | Borrower | Loan Amount |
|---|---|---|---|
| Open | Benseler Andrew Scott | $349,700 | |
| Closed | Benseler Andrew | $369,600 | |
| Previous Owner | Vaas Jonathan | $171,900 | |
| Previous Owner | Pant Gautam | $286,000 | |
| Previous Owner | Johnson Deonne B | $240,450 | |
| Previous Owner | Heyn Robert D | $220,000 | |
| Previous Owner | Mcomber Michael C | $92,393 |
Source: Public Records
Tax History Compared to Growth
Tax History
| Year | Tax Paid | Tax Assessment Tax Assessment Total Assessment is a certain percentage of the fair market value that is determined by local assessors to be the total taxable value of land and additions on the property. | Land | Improvement |
|---|---|---|---|---|
| 2025 | $3,810 | $788,600 | $223,100 | $565,500 |
| 2024 | $3,810 | $726,900 | $212,900 | $514,000 |
| 2023 | $3,640 | $669,400 | $204,700 | $464,700 |
| 2022 | $3,859 | $665,900 | $200,700 | $465,200 |
| 2021 | $3,554 | $555,300 | $163,000 | $392,300 |
| 2020 | $3,563 | $529,800 | $152,300 | $377,500 |
| 2019 | $3,540 | $495,300 | $126,900 | $368,400 |
| 2018 | $3,527 | $480,500 | $126,900 | $353,600 |
| 2017 | $3,654 | $466,400 | $126,900 | $339,500 |
| 2016 | $3,497 | $423,800 | $126,900 | $296,900 |
| 2015 | -- | $407,500 | $130,700 | $276,800 |
| 2014 | $3,348 | $381,600 | $130,700 | $250,900 |
Source: Public Records
Map
Nearby Homes
- 2326 E 1700 S
- 2225 Ramona Ave
- 2366 Logan Ave S
- 2138 E Wilson Ave
- 1769 S Foothill Dr
- 1940 S 2500 E
- 2266 E Kensington Ave
- 2125 Logan Ave S
- 2213 E 2100 S
- 1502 S 2400 E
- 2109 S Texas St
- 1881 Foothill Dr
- 1876 S 2600 E
- 1974 Laurelhurst Dr E
- 2119 King St
- 1908 S 2600 E
- 1825 S 2600 E
- 1802 S Wasatch Dr
- 1444 Beacon Dr
- 2157 S Dallin St
- 1826 Nevada St
- 1834 Nevada St
- 1834 S Nevada St
- 1818 Nevada St
- 1825 S 2300 E
- 1842 Nevada St
- 1810 Nevada St
- 1833 S 2300 E
- 1817 S 2300 E
- 1841 S 2300 E
- 1809 S 2300 E
- 1850 Nevada St
- 2318 E Wilson Ave
- 2318 Wilson Ave
- 1796 Nevada St
- 1849 S 2300 E
- 2310 E Wilson Ave
- 2310 Wilson Ave
- 1795 S 2300 E
- 1858 S Nevada St