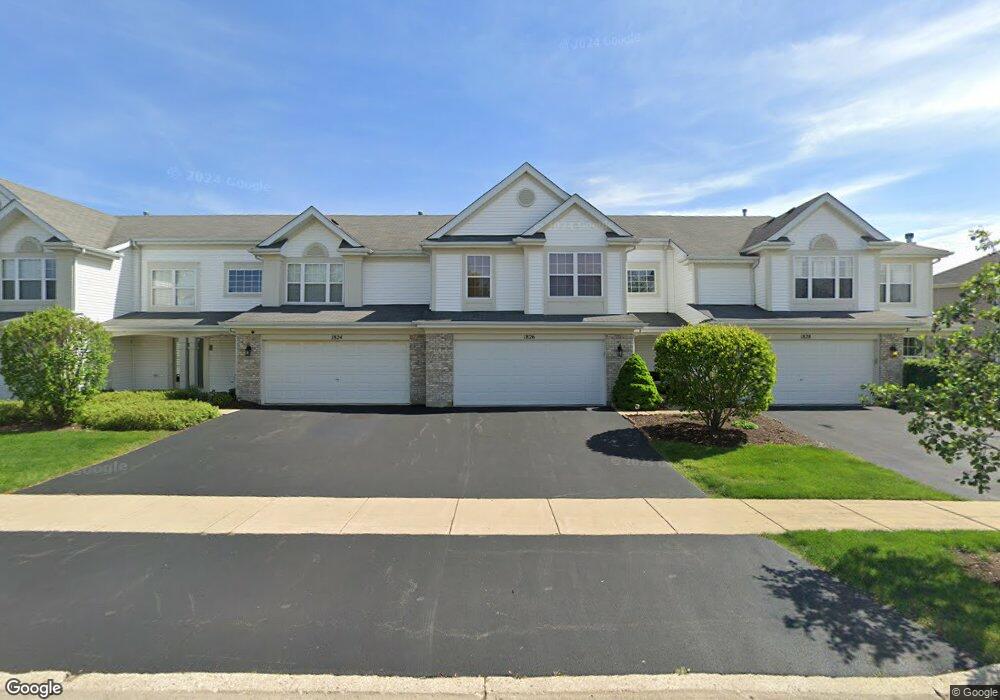
1826 Waverly Way Montgomery, IL 60538
Estimated Value: $282,000 - $293,663
3
Beds
3
Baths
1,546
Sq Ft
$187/Sq Ft
Est. Value
About This Home
This home is located at 1826 Waverly Way, Montgomery, IL 60538 and is currently estimated at $289,166, approximately $187 per square foot. 1826 Waverly Way is a home located in Kane County with nearby schools including Kaneland Mcdole Elementary School, Harter Middle School, and Kaneland High School.
Ownership History
Date
Name
Owned For
Owner Type
Purchase Details
Closed on
Aug 31, 2023
Sold by
Cunningham Tracy
Bought by
Cunningham Tracy and Cunningham Sid
Current Estimated Value
Purchase Details
Closed on
Nov 29, 2012
Sold by
Ross Matthew John and Ross Lisabeth
Bought by
Cunnigham Tracy
Home Financials for this Owner
Home Financials are based on the most recent Mortgage that was taken out on this home.
Original Mortgage
$111,935
Interest Rate
3.37%
Mortgage Type
FHA
Purchase Details
Closed on
Jun 28, 2005
Sold by
Drh Cambridge Homes Inc
Bought by
Ross Matthew John and Ross Lisbeth Coromoto
Home Financials for this Owner
Home Financials are based on the most recent Mortgage that was taken out on this home.
Original Mortgage
$159,760
Interest Rate
5.5%
Mortgage Type
Purchase Money Mortgage
Create a Home Valuation Report for This Property
The Home Valuation Report is an in-depth analysis detailing your home's value as well as a comparison with similar homes in the area
Home Values in the Area
Average Home Value in this Area
Purchase History
| Date | Buyer | Sale Price | Title Company |
|---|---|---|---|
| Cunningham Tracy | -- | None Listed On Document | |
| Cunnigham Tracy | $114,000 | Old Republic National Title | |
| Ross Matthew John | $200,000 | Chicago Title Insurance Comp |
Source: Public Records
Mortgage History
| Date | Status | Borrower | Loan Amount |
|---|---|---|---|
| Previous Owner | Cunnigham Tracy | $111,935 | |
| Previous Owner | Ross Matthew John | $159,760 |
Source: Public Records
Tax History Compared to Growth
Tax History
| Year | Tax Paid | Tax Assessment Tax Assessment Total Assessment is a certain percentage of the fair market value that is determined by local assessors to be the total taxable value of land and additions on the property. | Land | Improvement |
|---|---|---|---|---|
| 2024 | $5,652 | $72,524 | $11,006 | $61,518 |
| 2023 | $5,305 | $64,209 | $9,926 | $54,283 |
| 2022 | $5,181 | $59,278 | $9,164 | $50,114 |
| 2021 | $4,985 | $56,412 | $8,721 | $47,691 |
| 2020 | $4,916 | $55,209 | $8,535 | $46,674 |
| 2019 | $4,858 | $53,404 | $8,256 | $45,148 |
| 2018 | $4,899 | $52,674 | $9,411 | $43,263 |
| 2017 | $4,749 | $50,305 | $8,988 | $41,317 |
| 2016 | $4,856 | $50,167 | $8,592 | $41,575 |
| 2015 | -- | $42,421 | $7,994 | $34,427 |
| 2014 | -- | $40,563 | $7,644 | $32,919 |
| 2013 | -- | $50,497 | $7,724 | $42,773 |
Source: Public Records
Map
Nearby Homes
- 1725 Wick Way
- 2891 Frances Ln
- 3014 Shetland Ln
- 2212 Gallant Fox Cir Unit 702
- 2254 Gallant Fox Cir Unit 303
- 2930 Heather Ln Unit 1
- 2267 Margaret Dr
- 2214 Andrew Trail Unit 1
- 1883 Faxon Dr
- 2906 Meadowview Ln
- 1808 Candlelight Cir Unit 121
- 1850 Candlelight Cir Unit 173
- 2717 Avalon Ln
- 1715 Ivy Ln
- 2417 Geneva Ln Unit 3
- 2092 William Dr
- 2455 Montclair Ln
- 2335 Thunder Gulch Rd Unit 4
- 3228 Millrace Ln
- 2091 Jericho Rd
- 1824 Waverly Way
- 1828 Waverly Way
- 1822 Waverly Way
- 1820 Waverly Way
- 1830 Waverly Way
- 1832 Waverly Way
- 1806 Waverly Way
- 1806 Waverly Way
- 1834 Waverly Way
- 1829 Waverly Way Unit 5
- 1804 Waverly Way
- 1807 Waverly Way
- 1836 Waverly Way
- 1827 Waverly Way
- 1802 Waverly Way
- 1831 Waverly Way Unit 5
- 1833 Waverly Way
- 1825 Waverly Way
- 1835 Waverly Way Unit 5
- 1800 Waverly Way