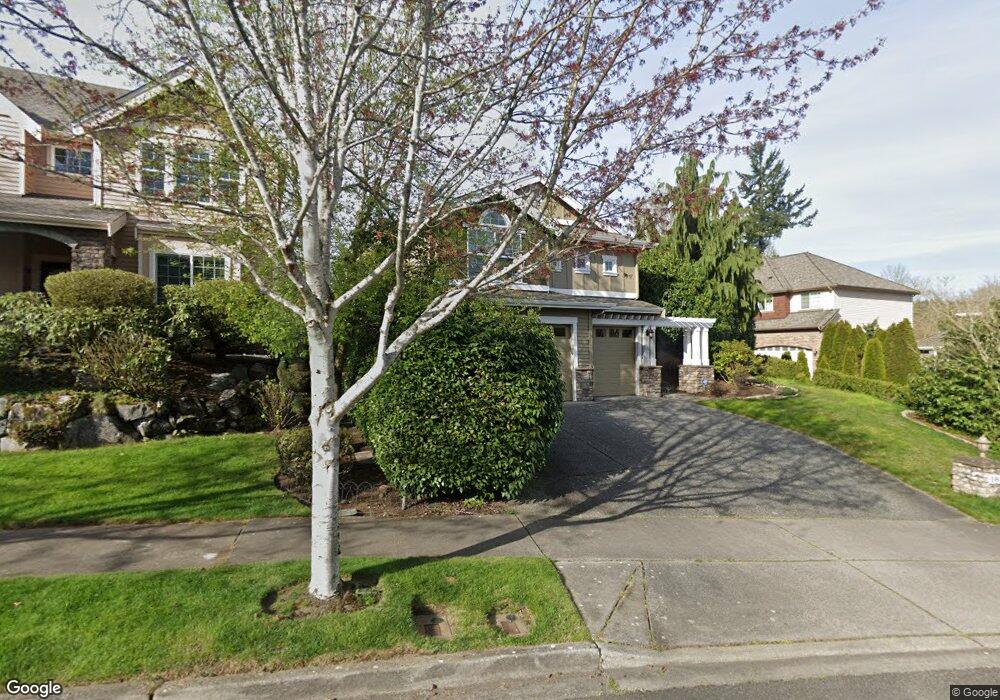
1827 235th Place SW Bothell, WA 98021
Estimated Value: $1,230,444 - $1,637,000
3
Beds
3
Baths
2,713
Sq Ft
$511/Sq Ft
Est. Value
About This Home
This home is located at 1827 235th Place SW, Bothell, WA 98021 and is currently estimated at $1,386,861, approximately $511 per square foot. 1827 235th Place SW is a home located in Snohomish County with nearby schools including Lockwood Elementary School, Kenmore Middle School, and Bothell High School.
Ownership History
Date
Name
Owned For
Owner Type
Purchase Details
Closed on
Oct 5, 2020
Sold by
Sherbert Stephen
Bought by
Sherbert Natalie
Current Estimated Value
Purchase Details
Closed on
Jul 7, 2011
Sold by
Smith Ronald E and Smith Hasbrouck N
Bought by
Sherbert Stephen and Sherbert Natalie
Home Financials for this Owner
Home Financials are based on the most recent Mortgage that was taken out on this home.
Original Mortgage
$320,000
Outstanding Balance
$219,526
Interest Rate
4.45%
Mortgage Type
New Conventional
Estimated Equity
$1,167,335
Purchase Details
Closed on
Apr 22, 2008
Sold by
Emerald Pacific Homes Inc
Bought by
Smith Ronald E and Smith Hasbrouck N
Home Financials for this Owner
Home Financials are based on the most recent Mortgage that was taken out on this home.
Original Mortgage
$515,950
Interest Rate
5.25%
Mortgage Type
Purchase Money Mortgage
Create a Home Valuation Report for This Property
The Home Valuation Report is an in-depth analysis detailing your home's value as well as a comparison with similar homes in the area
Home Values in the Area
Average Home Value in this Area
Purchase History
| Date | Buyer | Sale Price | Title Company |
|---|---|---|---|
| Sherbert Natalie | -- | None Available | |
| Sherbert Stephen | $490,280 | First American | |
| Smith Ronald E | $644,950 | Chicago Title |
Source: Public Records
Mortgage History
| Date | Status | Borrower | Loan Amount |
|---|---|---|---|
| Open | Sherbert Stephen | $320,000 | |
| Previous Owner | Smith Ronald E | $515,950 |
Source: Public Records
Tax History Compared to Growth
Tax History
| Year | Tax Paid | Tax Assessment Tax Assessment Total Assessment is a certain percentage of the fair market value that is determined by local assessors to be the total taxable value of land and additions on the property. | Land | Improvement |
|---|---|---|---|---|
| 2025 | $8,371 | $1,029,600 | $550,000 | $479,600 |
| 2024 | $8,371 | $996,000 | $555,000 | $441,000 |
| 2023 | $8,742 | $1,133,100 | $640,000 | $493,100 |
| 2022 | $8,179 | $848,600 | $430,000 | $418,600 |
| 2020 | $8,472 | $663,000 | $311,000 | $352,000 |
| 2019 | $6,968 | $689,200 | $275,000 | $414,200 |
| 2018 | $6,589 | $614,600 | $245,000 | $369,600 |
| 2017 | $5,510 | $527,500 | $180,000 | $347,500 |
| 2016 | $5,421 | $502,900 | $170,000 | $332,900 |
| 2015 | $5,489 | $479,700 | $155,000 | $324,700 |
| 2013 | $5,163 | $392,300 | $140,000 | $252,300 |
Source: Public Records
Map
Nearby Homes
- 23605 20th Ave W
- 23609 20th Ave W
- 23623 20th Ave W
- 23615 20th Ave W
- 23619 20th Ave W
- 23520 20th Ave W
- 23518 20th Ave W
- 23708 Locust Way Unit 64
- 23708 Locust Way Unit 65
- 23708 Locust Way Unit 23
- 23708 Locust Way Unit 29
- 23708 Locust Way Unit 9
- 24115 22nd Place W
- 2015 228th Place SW
- 1509 243rd Place SW Unit 1
- 1515 243rd Place SW Unit 2B
- 1313 228th Place SW
- 24328 Carter Rd Unit 5A
- 24328 Carter Rd Unit 4A
- 1524 243rd Place SW Unit B
- 1831 235th Place SW
- 1823 235th Place SW
- 1819 235th Place SW
- 1901 235th Place SW
- 1830 234th Place SW
- 23529 19th Ave W
- 1826 234th Place SW
- 23424 Locust Way
- 1907 235th Place SW
- 1815 235th Place SW
- 23603 19th Ave W
- 1908 234th Place SW
- 23532 19th Ave W
- 1811 235th Place SW
- 1816 235th Place SW
- 1913 235th Place SW
- 1822 234th Place SW
- 23607 19th Ave W
- 23604 19th Ave W
- 1912 234th Place SW