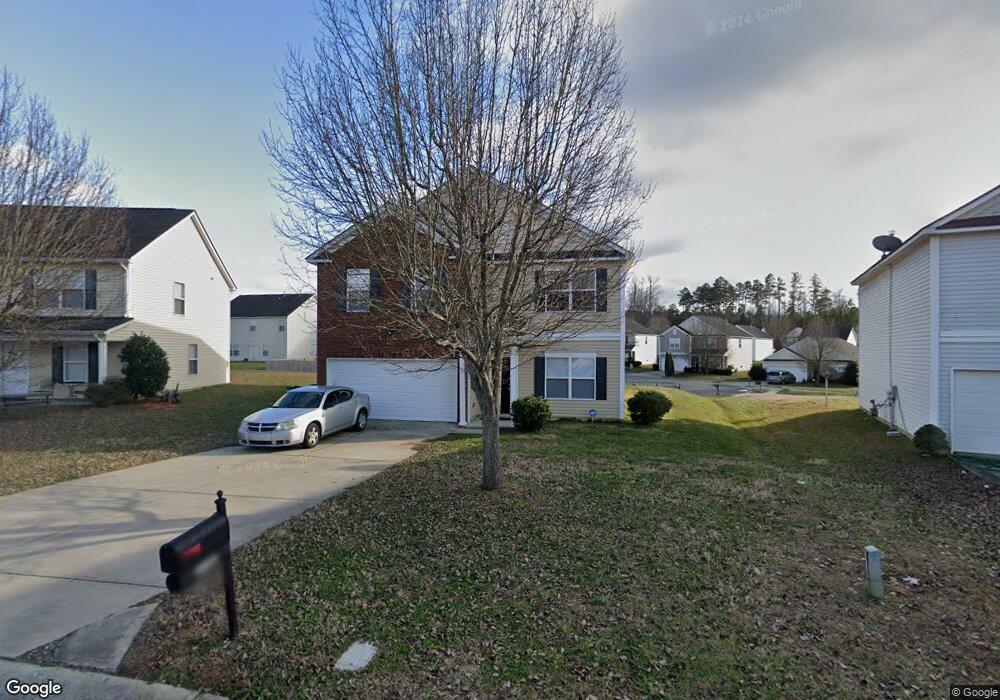
1827 Bray Dr Charlotte, NC 28214
Harwood Lane NeighborhoodEstimated Value: $351,249 - $394,000
4
Beds
3
Baths
2,477
Sq Ft
$150/Sq Ft
Est. Value
About This Home
This home is located at 1827 Bray Dr, Charlotte, NC 28214 and is currently estimated at $372,562, approximately $150 per square foot. 1827 Bray Dr is a home located in Mecklenburg County with nearby schools including River Oaks Academy, Coulwood STEM Academy, and West Mecklenburg High.
Ownership History
Date
Name
Owned For
Owner Type
Purchase Details
Closed on
Jul 22, 2024
Sold by
Wilson Frensceno and Wilson Aleisa
Bought by
Dela Torre Francico
Current Estimated Value
Purchase Details
Closed on
Jul 30, 2009
Sold by
Secretary Of Housing & Urban Development
Bought by
Wilson Frensceno
Home Financials for this Owner
Home Financials are based on the most recent Mortgage that was taken out on this home.
Original Mortgage
$116,910
Interest Rate
5.37%
Mortgage Type
FHA
Purchase Details
Closed on
Apr 17, 2009
Sold by
Mcmillan Jacques
Bought by
Secretary Of Housing & Urban Development
Purchase Details
Closed on
Sep 24, 2003
Sold by
Beazer Homes Corp
Bought by
Mcmillan Jacques
Home Financials for this Owner
Home Financials are based on the most recent Mortgage that was taken out on this home.
Original Mortgage
$150,353
Interest Rate
6.24%
Mortgage Type
FHA
Purchase Details
Closed on
Jul 24, 2003
Sold by
Stoney Creek Subdivision Llc
Bought by
Beazer Homes Corp
Create a Home Valuation Report for This Property
The Home Valuation Report is an in-depth analysis detailing your home's value as well as a comparison with similar homes in the area
Home Values in the Area
Average Home Value in this Area
Purchase History
| Date | Buyer | Sale Price | Title Company |
|---|---|---|---|
| Dela Torre Francico | $290,000 | Investors Title Insurance Comp | |
| Wilson Frensceno | -- | None Available | |
| Secretary Of Housing & Urban Development | $156,340 | None Available | |
| Mcmillan Jacques | $152,000 | -- | |
| Beazer Homes Corp | $489,000 | -- |
Source: Public Records
Mortgage History
| Date | Status | Borrower | Loan Amount |
|---|---|---|---|
| Previous Owner | Wilson Frensceno | $116,910 | |
| Previous Owner | Mcmillan Jacques | $150,353 |
Source: Public Records
Tax History Compared to Growth
Tax History
| Year | Tax Paid | Tax Assessment Tax Assessment Total Assessment is a certain percentage of the fair market value that is determined by local assessors to be the total taxable value of land and additions on the property. | Land | Improvement |
|---|---|---|---|---|
| 2025 | $2,951 | $369,400 | $75,000 | $294,400 |
| 2024 | $2,951 | $369,400 | $75,000 | $294,400 |
| 2023 | $2,849 | $369,400 | $75,000 | $294,400 |
| 2022 | $2,206 | $215,600 | $25,000 | $190,600 |
| 2021 | $2,195 | $215,600 | $25,000 | $190,600 |
| 2020 | $2,188 | $215,600 | $25,000 | $190,600 |
| 2019 | $2,172 | $215,600 | $25,000 | $190,600 |
| 2018 | $2,078 | $152,800 | $22,500 | $130,300 |
| 2017 | $2,041 | $152,800 | $22,500 | $130,300 |
| 2016 | $2,031 | $152,800 | $22,500 | $130,300 |
| 2015 | $2,020 | $152,800 | $22,500 | $130,300 |
| 2014 | $1,371 | $0 | $0 | $0 |
Source: Public Records
Map
Nearby Homes
- 8926 Rockrose Way
- 1702 Bray Dr
- 1132 Mt Holly Huntersville Rd
- 11004 Dipali Ct
- 1134 Riverside Dr
- 2127 Newhart Rd
- 1130, 1124 Riverside Dr
- 4110 Dillingham Ct
- 822 Mt Holly Huntersville Rd
- 10925 Lassen Ct
- 9608 Brackenview Ct
- 1408 Hart Rd
- 1607 Hart Rd
- 2406 Harwood Hills Ln
- 10912 Partridge Cross Ln
- 1815 Sugar Hollow Dr
- 10621 Shanon Darby Ln
- 10630 Northwoods Forest Dr
- 13012 Suncreek Terrace
- 12032 Basking Dr
- 1823 Bray Dr
- 1831 Bray Dr
- 11526 Carnsore Ct
- 1819 Bray Dr
- 11518 Carnsore Ct
- 1835 Bray Dr
- 1824 Bray Dr
- 11514 Carnsore Ct
- 1818 Bray Dr
- 11543 Carnsore Ct
- 1839 Bray Dr
- 11535 Carnsore Ct
- 11539 Carnsore Ct
- 11531 Carnsore Ct
- 1811 Bray Dr
- 11527 Carnsore Ct
- 1810 Bray Dr
- 1807 Bray Dr
- 11523 Carnsore Ct
- 9842 Holly Park Dr