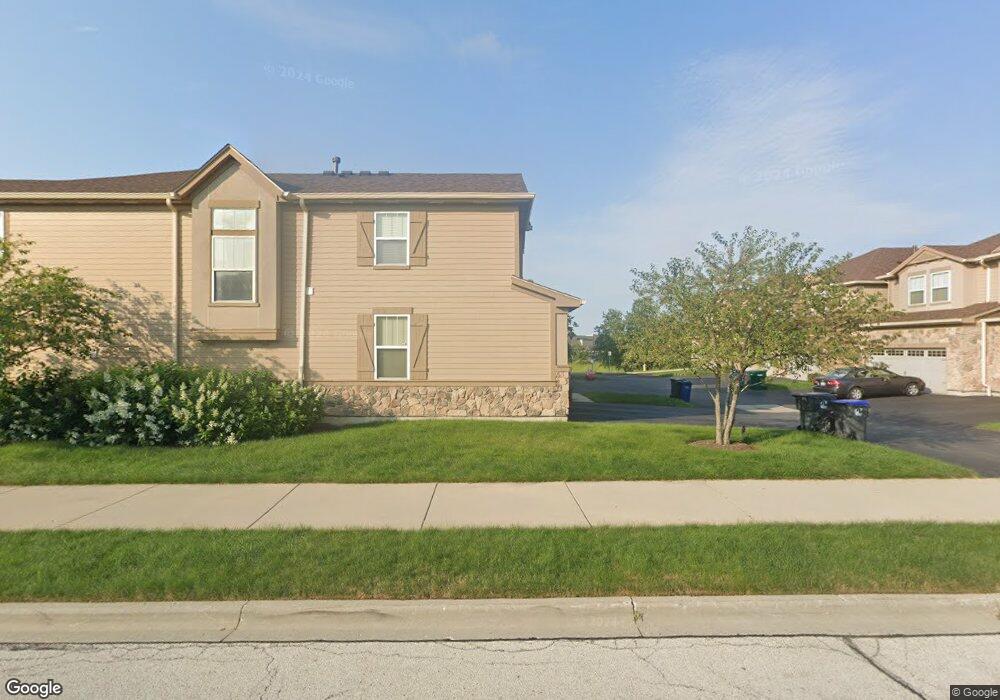
1827 Crenshaw Cir Unit 112 Vernon Hills, IL 60061
Gregg's Landing NeighborhoodEstimated Value: $466,506 - $525,000
--
Bed
3
Baths
2,245
Sq Ft
$215/Sq Ft
Est. Value
About This Home
This home is located at 1827 Crenshaw Cir Unit 112, Vernon Hills, IL 60061 and is currently estimated at $483,377, approximately $215 per square foot. 1827 Crenshaw Cir Unit 112 is a home located in Lake County with nearby schools including Hawthorn School Of Dual Language, Hawthorn Elementary School South, and Hawthorn Middle School North.
Ownership History
Date
Name
Owned For
Owner Type
Purchase Details
Closed on
Jun 22, 2010
Sold by
U S Bank National Association
Bought by
Cha Seoyeon J and Cha Joseph W
Current Estimated Value
Home Financials for this Owner
Home Financials are based on the most recent Mortgage that was taken out on this home.
Original Mortgage
$220,000
Interest Rate
4.7%
Mortgage Type
New Conventional
Purchase Details
Closed on
Jun 11, 2010
Sold by
Chrisos David
Bought by
Us Bank National Association
Home Financials for this Owner
Home Financials are based on the most recent Mortgage that was taken out on this home.
Original Mortgage
$220,000
Interest Rate
4.7%
Mortgage Type
New Conventional
Purchase Details
Closed on
Mar 25, 2005
Sold by
Kb Home Illinois Inc
Bought by
Chrisos David and Chrisos Kathleen
Home Financials for this Owner
Home Financials are based on the most recent Mortgage that was taken out on this home.
Original Mortgage
$342,420
Interest Rate
6.75%
Mortgage Type
Unknown
Create a Home Valuation Report for This Property
The Home Valuation Report is an in-depth analysis detailing your home's value as well as a comparison with similar homes in the area
Home Values in the Area
Average Home Value in this Area
Purchase History
| Date | Buyer | Sale Price | Title Company |
|---|---|---|---|
| Cha Seoyeon J | $275,000 | Fidelity National Title | |
| Us Bank National Association | -- | None Available | |
| Chrisos David | $428,500 | -- |
Source: Public Records
Mortgage History
| Date | Status | Borrower | Loan Amount |
|---|---|---|---|
| Previous Owner | Cha Seoyeon J | $220,000 | |
| Previous Owner | Chrisos David | $342,420 |
Source: Public Records
Tax History Compared to Growth
Tax History
| Year | Tax Paid | Tax Assessment Tax Assessment Total Assessment is a certain percentage of the fair market value that is determined by local assessors to be the total taxable value of land and additions on the property. | Land | Improvement |
|---|---|---|---|---|
| 2024 | $11,621 | $143,522 | $38,038 | $105,484 |
| 2023 | $11,228 | $132,376 | $35,084 | $97,292 |
| 2022 | $11,228 | $126,285 | $33,721 | $92,564 |
| 2021 | $10,745 | $123,566 | $32,995 | $90,571 |
| 2020 | $10,355 | $121,488 | $32,440 | $89,048 |
| 2019 | $10,094 | $120,333 | $32,132 | $88,201 |
| 2018 | $10,311 | $124,857 | $37,751 | $87,106 |
| 2017 | $10,152 | $120,915 | $36,559 | $84,356 |
| 2016 | $9,736 | $114,644 | $34,663 | $79,981 |
| 2015 | $9,589 | $107,154 | $32,398 | $74,756 |
| 2014 | $8,565 | $98,887 | $31,050 | $67,837 |
| 2012 | $9,030 | $94,996 | $29,829 | $65,167 |
Source: Public Records
Map
Nearby Homes
- 1952 Crenshaw Cir Unit 193
- 1855 Lake Charles Dr
- 403 N White Deer Trail
- 1620 Nicklaus Ct
- 1933 Lake Charles Dr
- 716 Ascot Ct Unit 104B
- 1939 Lake Charles Dr
- 439 Pine Lake Cir Unit 1
- 349 Pine Lake Cir
- 810 Braeman Ct Unit 2B
- 280 Cypress Ln
- 606 Paddock Ln
- 1969 Royal Birkdale Dr
- 501 Hemlock Ln
- 410 Bay Tree Cir
- 418 Bay Tree Cir
- 193 Hemingway Ct Unit 262
- 635 E Golf Rd
- 323 W Golf Rd
- 827 5th Ave
- 1827 Crenshaw Cir Unit 2
- 1825 Crenshaw Cir Unit 11
- 1831 Crenshaw Cir Unit 114
- 1833 Crenshaw Cir Unit 115
- 1817 Crenshaw Cir Unit 124
- 1819 Crenshaw Cir Unit 123
- 1817 Crenshaw Cir Unit 1817
- 1815 Crenshaw Cir Unit 125
- 1821 Crenshaw Cir Unit 122
- 1823 Crenshaw Cir Unit 121
- 1871 Crenshaw Cir Unit 101
- 1869 Crenshaw Cir Unit 102
- 1867 Crenshaw Cir Unit 103
- 1867 Crenshaw Cir
- 1865 Crenshaw Cir Unit 104
- 1863 Crenshaw Cir Unit 105
- 1863 Crenshaw Cir Unit 1863
- 1808 Crenshaw Cir Unit 14
- 1861 Crenshaw Cir Unit 106
- 1810 Crenshaw Cir Unit 1