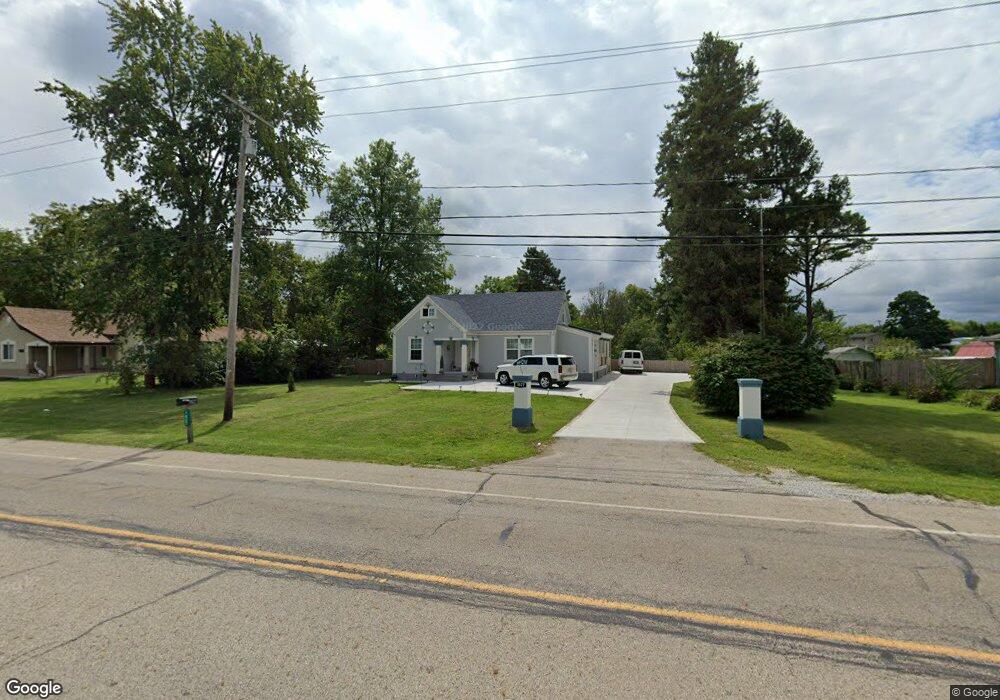
1827 E Leffel Ln Springfield, OH 45505
Estimated Value: $202,748 - $269,000
3
Beds
2
Baths
1,646
Sq Ft
$148/Sq Ft
Est. Value
About This Home
This home is located at 1827 E Leffel Ln, Springfield, OH 45505 and is currently estimated at $243,437, approximately $147 per square foot. 1827 E Leffel Ln is a home located in Clark County with nearby schools including Possum Elementary School, Shawnee Middle School/High School, and Springfield Preparatory & Fitness Academy.
Ownership History
Date
Name
Owned For
Owner Type
Purchase Details
Closed on
Jul 28, 2020
Sold by
Huitron Saucedo Juan Diego
Bought by
Flores Laura Villalpando
Current Estimated Value
Purchase Details
Closed on
Nov 5, 2019
Sold by
Gomez Jose A and Sanchez Maria Teresa Sosa
Bought by
Saucedo Juan Diego Huitron and Flores Laura Villapando
Purchase Details
Closed on
Nov 27, 2018
Sold by
Hornbeck John David and Hornbeck John D
Bought by
Gomez Jose A
Purchase Details
Closed on
Jul 28, 2000
Sold by
Hornbeck John H and Hornbeck Jean E
Bought by
Hornbeck John David
Home Financials for this Owner
Home Financials are based on the most recent Mortgage that was taken out on this home.
Original Mortgage
$70,000
Interest Rate
8.19%
Create a Home Valuation Report for This Property
The Home Valuation Report is an in-depth analysis detailing your home's value as well as a comparison with similar homes in the area
Home Values in the Area
Average Home Value in this Area
Purchase History
| Date | Buyer | Sale Price | Title Company |
|---|---|---|---|
| Flores Laura Villalpando | -- | Herier David D | |
| Saucedo Juan Diego Huitron | $21,000 | None Available | |
| Gomez Jose A | $61,000 | Home Services Title | |
| Hornbeck John David | $90,000 | -- |
Source: Public Records
Mortgage History
| Date | Status | Borrower | Loan Amount |
|---|---|---|---|
| Previous Owner | Hornbeck John David | $70,000 |
Source: Public Records
Tax History
| Year | Tax Paid | Tax Assessment Tax Assessment Total Assessment is a certain percentage of the fair market value that is determined by local assessors to be the total taxable value of land and additions on the property. | Land | Improvement |
|---|---|---|---|---|
| 2025 | $5,416 | $72,290 | $12,690 | $59,600 |
| 2024 | $3,794 | $49,000 | $9,190 | $39,810 |
| 2023 | $3,783 | $49,000 | $9,190 | $39,810 |
| 2022 | $4,892 | $49,000 | $9,190 | $39,810 |
| 2021 | $2,112 | $38,160 | $7,120 | $31,040 |
| 2020 | $2,129 | $38,160 | $7,120 | $31,040 |
| 2019 | $2,163 | $38,160 | $7,120 | $31,040 |
| 2018 | $2,116 | $37,640 | $6,480 | $31,160 |
| 2017 | $2,171 | $37,632 | $6,475 | $31,157 |
| 2016 | $1,960 | $37,632 | $6,475 | $31,157 |
| 2015 | $1,456 | $36,453 | $6,475 | $29,978 |
| 2014 | $928 | $36,453 | $6,475 | $29,978 |
| 2013 | $1,025 | $36,453 | $6,475 | $29,978 |
Source: Public Records
Map
Nearby Homes
- 2390 Old Selma Rd
- 1621 Victory Dr
- 2215 Hackberry St
- 2216 Hackberry St
- 2214 Hackberry St
- 2212 Hackberry St
- 2210 Hackberry St
- 2218 Tanager Rd
- 1806 N Sweetbriar Ln
- 1716 N Sweetbriar Ln
- 2040 N Hadley Rd
- 2108 Sunset Ave
- 1823 Rutland Ave
- 1440 Selma Rd
- 711 Kinnane Ave
- 1846 Ohio Ave
- 1225 Beacon St
- 2811 Oletha Ave
- 2076-2078 Stowe Dr
- 2076 Stowe Dr
- 1905 E Leffel Ln
- 1815 E Leffel Ln
- 0 E Leffel Ln
- 1915 E Leffel Ln
- 1925 E Leffel Ln
- 1777 E Leffel Ln
- 1755 E Leffel Ln
- 2370 Old Selma Rd
- 1945 E Leffel Ln
- 2320 Old Selma Rd
- 2380 Selma Rd
- 1707 E Leffel Ln
- 2377 Old Selma Rd
- 2377 Old Selma Rd
- 2400 Old Selma Rd
- 2436 Old Selma Rd
- 1651 E Leffel Ln
- 2384 Old Selma Rd
- 1601 E Leffel Ln
- 0 Progress Dr Unit 1017542
Your Personal Tour Guide
Ask me questions while you tour the home.