Estimated Value: $175,000 - $201,000
3
Beds
2
Baths
1,393
Sq Ft
$133/Sq Ft
Est. Value
About This Home
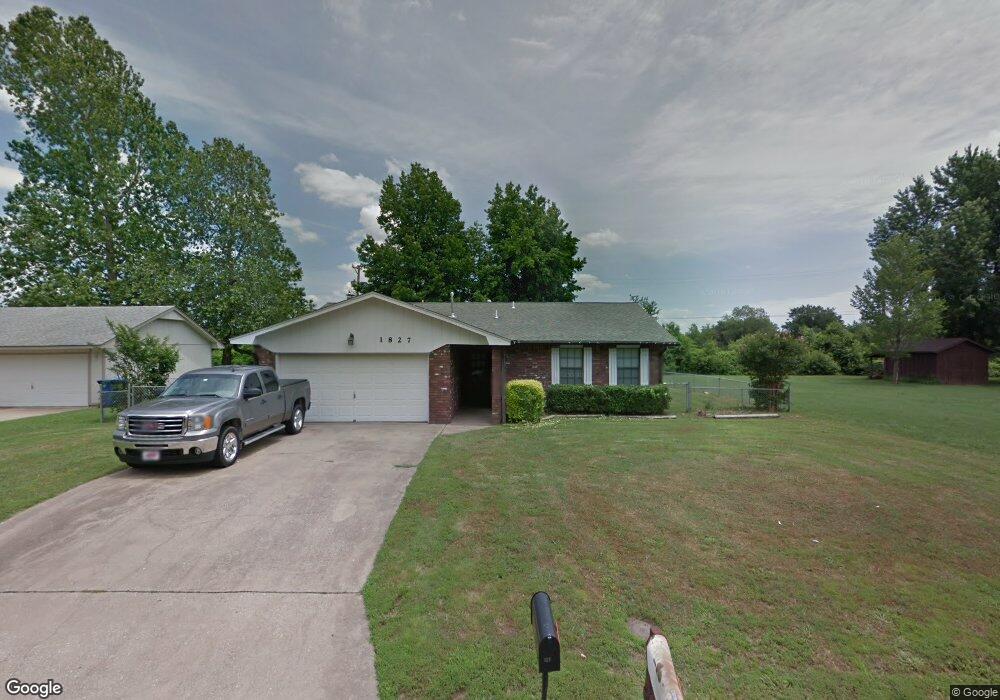
This home is located at 1827 K St SW, Miami, OK 74354 and is currently estimated at $184,880, approximately $132 per square foot. 1827 K St SW is a home located in Ottawa County with nearby schools including Miami High School.
Ownership History
Date
Name
Owned For
Owner Type
Purchase Details
Closed on
Nov 19, 2021
Sold by
Henson Timothy W and Henson Gina C
Bought by
Dry Henry
Current Estimated Value
Home Financials for this Owner
Home Financials are based on the most recent Mortgage that was taken out on this home.
Original Mortgage
$143,117
Outstanding Balance
$131,142
Interest Rate
2.99%
Mortgage Type
VA
Estimated Equity
$53,738
Purchase Details
Closed on
Apr 5, 2007
Sold by
Carr Clifford L
Bought by
Henson Timothy W and Henson Gina C
Home Financials for this Owner
Home Financials are based on the most recent Mortgage that was taken out on this home.
Original Mortgage
$83,839
Interest Rate
6.15%
Mortgage Type
FHA
Create a Home Valuation Report for This Property
The Home Valuation Report is an in-depth analysis detailing your home's value as well as a comparison with similar homes in the area
Home Values in the Area
Average Home Value in this Area
Purchase History
| Date | Buyer | Sale Price | Title Company |
|---|---|---|---|
| Dry Henry | $140,000 | None Available | |
| Henson Timothy W | $92,500 | None Available |
Source: Public Records
Mortgage History
| Date | Status | Borrower | Loan Amount |
|---|---|---|---|
| Open | Dry Henry | $143,117 | |
| Previous Owner | Henson Timothy W | $83,839 |
Source: Public Records
Tax History Compared to Growth
Tax History
| Year | Tax Paid | Tax Assessment Tax Assessment Total Assessment is a certain percentage of the fair market value that is determined by local assessors to be the total taxable value of land and additions on the property. | Land | Improvement |
|---|---|---|---|---|
| 2024 | $1,552 | $16,097 | $969 | $15,128 |
| 2023 | $1,552 | $15,949 | $968 | $14,981 |
| 2022 | $1,474 | $15,949 | $968 | $14,981 |
| 2021 | $1,063 | $12,245 | $969 | $11,276 |
| 2020 | $1,038 | $11,888 | $969 | $10,919 |
| 2019 | $866 | $11,542 | $969 | $10,573 |
| 2018 | $871 | $11,542 | $969 | $10,573 |
| 2017 | $886 | $11,542 | $969 | $10,573 |
| 2016 | $822 | $11,226 | $969 | $10,257 |
| 2015 | $486 | $5,466 | $731 | $4,735 |
| 2014 | $838 | $11,226 | $969 | $10,257 |
Source: Public Records
Map
Nearby Homes