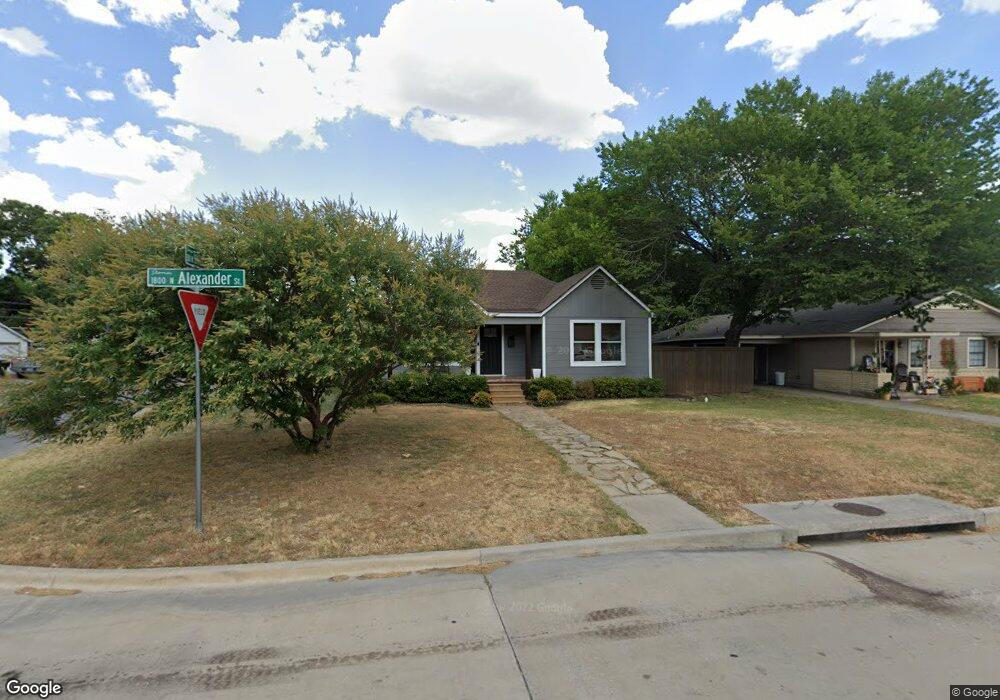
1827 N Alexander St Sherman, TX 75092
Estimated Value: $214,641 - $268,000
3
Beds
2
Baths
1,428
Sq Ft
$169/Sq Ft
Est. Value
About This Home
This home is located at 1827 N Alexander St, Sherman, TX 75092 and is currently estimated at $241,321, approximately $168 per square foot. 1827 N Alexander St is a home located in Grayson County with nearby schools including Fairview Elementary School, Piner Middle School, and Dillingham Intermediate School.
Ownership History
Date
Name
Owned For
Owner Type
Purchase Details
Closed on
Feb 28, 2020
Sold by
Ayala Richard and Ayala Julie
Bought by
Miller Marie
Current Estimated Value
Home Financials for this Owner
Home Financials are based on the most recent Mortgage that was taken out on this home.
Original Mortgage
$178,703
Outstanding Balance
$160,434
Interest Rate
4.25%
Mortgage Type
FHA
Estimated Equity
$80,887
Purchase Details
Closed on
Jun 23, 2016
Sold by
Downtain David G
Bought by
Ayala Richard
Home Financials for this Owner
Home Financials are based on the most recent Mortgage that was taken out on this home.
Original Mortgage
$152,192
Interest Rate
3.95%
Mortgage Type
FHA
Purchase Details
Closed on
Nov 30, 2011
Sold by
Walker Kathy
Bought by
Downtain David G
Home Financials for this Owner
Home Financials are based on the most recent Mortgage that was taken out on this home.
Original Mortgage
$42,500
Interest Rate
4.03%
Mortgage Type
Seller Take Back
Purchase Details
Closed on
Oct 20, 2007
Sold by
Walker Kathy
Bought by
Dutton Monique
Create a Home Valuation Report for This Property
The Home Valuation Report is an in-depth analysis detailing your home's value as well as a comparison with similar homes in the area
Home Values in the Area
Average Home Value in this Area
Purchase History
| Date | Buyer | Sale Price | Title Company |
|---|---|---|---|
| Miller Marie | -- | Red River Title Co | |
| Ayala Richard | -- | Red River Title Co | |
| Downtain David G | -- | None Available | |
| Dutton Monique | -- | None Available |
Source: Public Records
Mortgage History
| Date | Status | Borrower | Loan Amount |
|---|---|---|---|
| Open | Miller Marie | $178,703 | |
| Previous Owner | Ayala Richard | $152,192 | |
| Previous Owner | Downtain David G | $42,500 |
Source: Public Records
Tax History Compared to Growth
Tax History
| Year | Tax Paid | Tax Assessment Tax Assessment Total Assessment is a certain percentage of the fair market value that is determined by local assessors to be the total taxable value of land and additions on the property. | Land | Improvement |
|---|---|---|---|---|
| 2025 | $3,467 | $217,762 | $66,277 | $151,485 |
| 2024 | $4,838 | $220,589 | $0 | $0 |
| 2023 | $3,044 | $200,535 | $42,441 | $158,094 |
| 2022 | $5,247 | $223,880 | $46,266 | $177,614 |
| 2021 | $4,583 | $182,862 | $43,784 | $139,078 |
| 2020 | $4,464 | $170,098 | $21,612 | $148,486 |
| 2019 | $4,258 | $157,983 | $10,166 | $147,817 |
| 2018 | $3,691 | $147,133 | $7,684 | $139,449 |
| 2017 | $3,385 | $135,972 | $7,684 | $128,288 |
| 2016 | $2,589 | $104,012 | $7,684 | $96,328 |
| 2015 | $1,326 | $53,394 | $7,684 | $45,710 |
| 2014 | $1,319 | $53,079 | $7,684 | $45,395 |
Source: Public Records
Map
Nearby Homes
- 415 W Taylor St
- 1718 N Shannon St
- 224 W Dexter St
- 210 W Dexter St
- 409 W Burton St
- 225 W Texas St
- 2106 N Alexander St
- 1611 N Alexander St
- 2117 N Shannon St
- 2121 N Alexander St
- 1711 N Ricketts St
- 426 W McGee St
- 2221 N Alexander St
- 311 W Scott St
- 2312 N Shannon St
- 2321 N Shannon St
- 2313 N Ricketts St
- 2401 N Alexander St
- 1709 N Binkley St
- 425 W Belden St
- 1819 N Alexander St Unit 1821
- 1819-1821 N Alexander St
- 1821 N Alexander St
- 316 W Taylor St
- 1903 N Alexander St
- 1817 N Alexander St
- 314 W Taylor St
- 1907 N Alexander St
- 1826 N Alexander St
- 1822 N Alexander St
- 319 W Taylor St
- 1811 N Alexander St
- 1900 N Alexander St
- 1911 N Alexander St
- 1818 N Alexander St
- 315 W Taylor St
- 1906 N Alexander St
- 311 W Taylor St
- 1810 N Alexander St
- 1915 N Alexander St