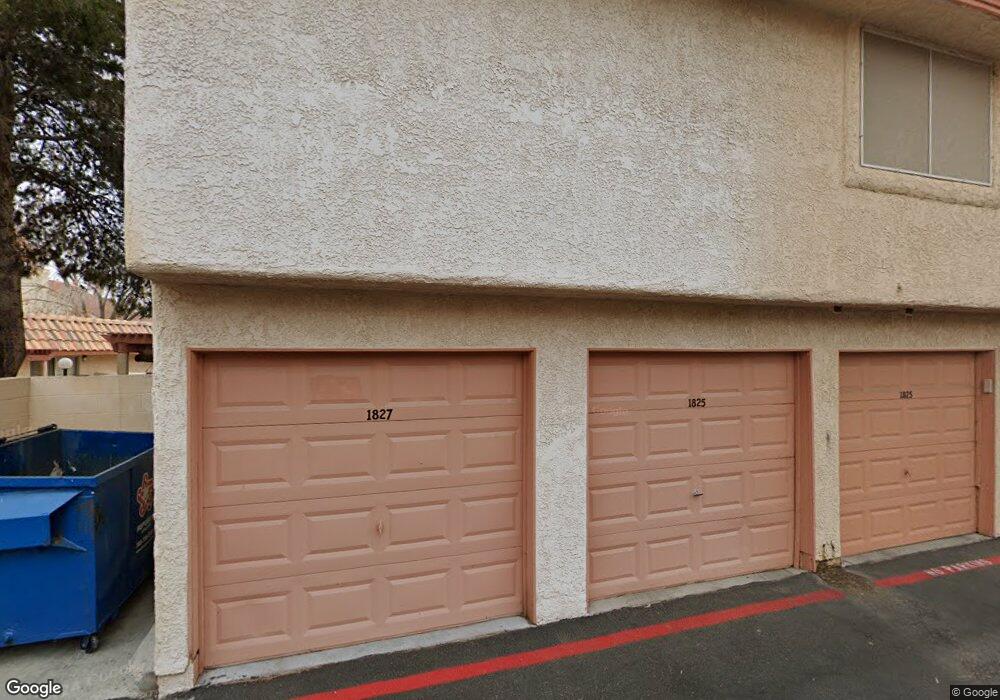
1827 Plum Ct Unit B Henderson, NV 89014
Green Valley North NeighborhoodEstimated Value: $204,000 - $223,000
1
Bed
2
Baths
840
Sq Ft
$253/Sq Ft
Est. Value
About This Home
This home is located at 1827 Plum Ct Unit B, Henderson, NV 89014 and is currently estimated at $212,223, approximately $252 per square foot. 1827 Plum Ct Unit B is a home located in Clark County with nearby schools including Harriet Treem Elementary School, Jim Thorpe Elementary School, and Francis H Cortney Junior High School.
Ownership History
Date
Name
Owned For
Owner Type
Purchase Details
Closed on
Sep 25, 2002
Sold by
Ashton Stewart
Bought by
Gallagher Joseph S
Current Estimated Value
Home Financials for this Owner
Home Financials are based on the most recent Mortgage that was taken out on this home.
Original Mortgage
$78,400
Outstanding Balance
$32,604
Interest Rate
6.05%
Mortgage Type
VA
Estimated Equity
$179,619
Purchase Details
Closed on
Dec 10, 1999
Sold by
Hud
Bought by
Ashton Stewart
Home Financials for this Owner
Home Financials are based on the most recent Mortgage that was taken out on this home.
Original Mortgage
$57,000
Interest Rate
7.96%
Purchase Details
Closed on
Sep 1, 1999
Sold by
Norwest Mtg Inc
Bought by
Hud
Create a Home Valuation Report for This Property
The Home Valuation Report is an in-depth analysis detailing your home's value as well as a comparison with similar homes in the area
Home Values in the Area
Average Home Value in this Area
Purchase History
| Date | Buyer | Sale Price | Title Company |
|---|---|---|---|
| Gallagher Joseph S | $76,900 | Land Title | |
| Ashton Stewart | $60,000 | Stewart Title Guaranty Compa | |
| Hud | -- | Ati Title | |
| Norwest Mtg Inc | $79,725 | Ati Title |
Source: Public Records
Mortgage History
| Date | Status | Borrower | Loan Amount |
|---|---|---|---|
| Open | Gallagher Joseph S | $78,400 | |
| Previous Owner | Ashton Stewart | $57,000 |
Source: Public Records
Tax History Compared to Growth
Tax History
| Year | Tax Paid | Tax Assessment Tax Assessment Total Assessment is a certain percentage of the fair market value that is determined by local assessors to be the total taxable value of land and additions on the property. | Land | Improvement |
|---|---|---|---|---|
| 2025 | $643 | $46,719 | $21,350 | $25,369 |
| 2024 | $596 | $46,719 | $21,350 | $25,369 |
| 2023 | $596 | $47,824 | $24,500 | $23,324 |
| 2022 | $552 | $41,398 | $19,005 | $22,393 |
| 2021 | $511 | $36,383 | $17,500 | $18,883 |
| 2020 | $472 | $37,396 | $17,500 | $19,896 |
| 2019 | $442 | $33,966 | $14,000 | $19,966 |
| 2018 | $422 | $28,107 | $8,750 | $19,357 |
| 2017 | $757 | $26,128 | $6,650 | $19,478 |
| 2016 | $396 | $24,634 | $5,600 | $19,034 |
| 2015 | $394 | $20,281 | $3,850 | $16,431 |
| 2014 | $383 | $12,814 | $3,500 | $9,314 |
Source: Public Records
Map
Nearby Homes
- 1818 Somersby Way
- 1843 Mimosa Ct
- 1808 Michael Ct
- 572 Cervantes Dr
- 1823 Rapier Dr Unit 1823
- 1939 Cutlass Dr Unit 92
- 1947 Cutlass Dr Unit 88
- 1979 Cutlass Dr Unit 72
- 615 Cervantes Dr
- 2695 Dulcinea Dr
- 1723 Comstock Dr
- 844 Flowing Meadow Dr
- 1700 Empire Mine Dr
- 1701 Comstock Dr
- 505 Meadbury Dr
- 426 Lost Trail Dr
- 1699 Sonoran Bluff Ave
- 2416 Greens Ave
- 1947 Sundown Canyon Dr
- 2220 Marlboro Dr
- 1825 Plum Ct Unit A
- 1829 Plum Ct
- 1831 Plum Ct
- 1839 Plum Ct
- 1837 Plum Ct
- 1833 Plum Ct Unit D
- 1835 Plum Ct
- 1817 Plum Ct Unit D
- 1819 Plum Ct
- 1823 Plum Ct
- 1821 Plum Ct
- 1830 Plum Ct Unit B
- 1828 Plum Ct Unit C
- 1832 Plum Ct Unit A
- 1822 Plum Ct
- 1820 Plum Ct
- 1824 Plum Ct
- 1818 Plum Ct
- 1824 Plum Ct Unit D
- 1820 Somersby Way