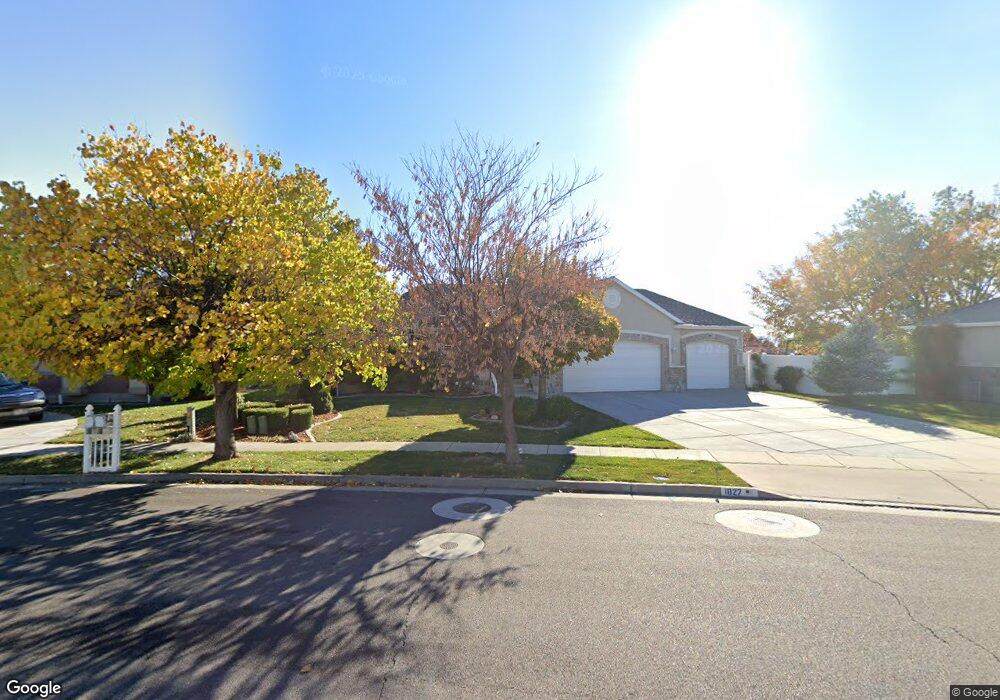
1827 W 2575 S Syracuse, UT 84075
Estimated Value: $600,197 - $608,000
5
Beds
3
Baths
3,079
Sq Ft
$196/Sq Ft
Est. Value
About This Home
This home is located at 1827 W 2575 S, Syracuse, UT 84075 and is currently estimated at $603,049, approximately $195 per square foot. 1827 W 2575 S is a home located in Davis County with nearby schools including Syracuse Elementary School, Syracuse Junior High School, and Syracuse High School.
Ownership History
Date
Name
Owned For
Owner Type
Purchase Details
Closed on
Dec 12, 2023
Sold by
Morgan Garland E
Bought by
Morgan Garland E and Morgan Eric E
Current Estimated Value
Purchase Details
Closed on
Mar 3, 2005
Sold by
Sirva Relocation Llc
Bought by
Morgan Garland E and Morgan Ute K
Purchase Details
Closed on
Feb 22, 2005
Sold by
Sirva Relocation Llc
Bought by
Morgan Garland E and Morgan Ute K
Purchase Details
Closed on
Dec 29, 2004
Sold by
Polson Russell G and Polson Danene M
Bought by
Sirva Relocation Llc
Purchase Details
Closed on
Jun 28, 1999
Sold by
Rainey Construction Inc
Bought by
Polson Russell G and Polson Danene M
Home Financials for this Owner
Home Financials are based on the most recent Mortgage that was taken out on this home.
Original Mortgage
$126,850
Interest Rate
7.2%
Create a Home Valuation Report for This Property
The Home Valuation Report is an in-depth analysis detailing your home's value as well as a comparison with similar homes in the area
Home Values in the Area
Average Home Value in this Area
Purchase History
| Date | Buyer | Sale Price | Title Company |
|---|---|---|---|
| Morgan Garland E | -- | None Listed On Document | |
| Morgan Garland E | -- | None Available | |
| Morgan Garland E | -- | Bonneville Title Company | |
| Sirva Relocation Llc | -- | Bonneville Title Company | |
| Sirva Relocation Llc | -- | Bonneville Title Company | |
| Polson Russell G | -- | First American Title Ins Co |
Source: Public Records
Mortgage History
| Date | Status | Borrower | Loan Amount |
|---|---|---|---|
| Previous Owner | Polson Russell G | $126,850 |
Source: Public Records
Tax History
| Year | Tax Paid | Tax Assessment Tax Assessment Total Assessment is a certain percentage of the fair market value that is determined by local assessors to be the total taxable value of land and additions on the property. | Land | Improvement |
|---|---|---|---|---|
| 2025 | -- | $298,650 | $126,836 | $171,814 |
| 2024 | -- | $287,100 | $106,708 | $180,392 |
| 2023 | $0 | $277,200 | $81,719 | $195,481 |
| 2022 | $2,763 | $539,000 | $155,053 | $383,947 |
| 2021 | $2,349 | $403,000 | $126,230 | $276,770 |
| 2020 | $2,060 | $349,000 | $109,052 | $239,948 |
| 2019 | $1,975 | $332,000 | $107,705 | $224,295 |
| 2018 | $1,970 | $328,000 | $103,421 | $224,579 |
| 2016 | $1,727 | $154,385 | $39,654 | $114,731 |
| 2015 | $2,035 | $144,815 | $39,654 | $105,161 |
| 2014 | $1,692 | $147,566 | $39,654 | $107,912 |
| 2013 | -- | $127,711 | $37,590 | $90,121 |
Source: Public Records
Map
Nearby Homes
- 1651 W 2700 S Unit 217
- 1643 W 2700 S Unit 216
- 1876 W 2400 S
- 1686 W 2425 S
- 2732 S Allison Way Unit 214
- 2742 S Allison Way Unit 212
- 2721 S Allison Way
- 1826 W 2350 S
- 2734 S Allison Way Unit 213
- 2894 Trailside Dr
- 2968 Old Emigrant Rd
- 1694 2975 S Unit D
- 1466 W 2425 S
- 1664 2975 S Unit B
- 2104 W 2200 S
- 2136 W 2200 S
- 1315 W 2325 S
- 1295 W 2325 S
- 2077 S 1575 W
- 1306 W 2325 S
Your Personal Tour Guide
Ask me questions while you tour the home.