
1827 Walnut St Anderson, IN 46016
Estimated payment $51/month
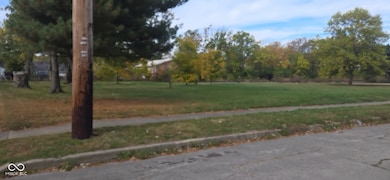
About This Lot
Lot for sale. 39x160 Lot size. Residential Vacant Land
Property Details
Property Type
- Land
Est. Annual Taxes
- $88
Lot Details
- 4,792 Sq Ft Lot
Schools
- Highland Middle School
- Anderson Intermediate School
Community Details
- Jackson Subdivision
Listing and Financial Details
- Tax Lot 481113401275000003
- Assessor Parcel Number 481113401275000003
Map
Home Values in the Area
Average Home Value in this Area
Tax History
| Year | Tax Paid | Tax Assessment Tax Assessment Total Assessment is a certain percentage of the fair market value that is determined by local assessors to be the total taxable value of land and additions on the property. | Land | Improvement |
|---|---|---|---|---|
| 2025 | $917 | $94,200 | $4,600 | $89,600 |
| 2024 | $917 | $86,400 | $4,600 | $81,800 |
| 2023 | $837 | $78,600 | $4,400 | $74,200 |
| 2022 | $833 | $79,000 | $4,100 | $74,900 |
| 2021 | $756 | $71,900 | $4,100 | $67,800 |
| 2020 | $720 | $68,400 | $3,900 | $64,500 |
| 2019 | $1,061 | $66,600 | $3,900 | $62,700 |
| 2018 | $1,305 | $60,900 | $3,900 | $57,000 |
| 2017 | $608 | $60,200 | $3,900 | $56,300 |
| 2016 | $127 | $60,200 | $3,900 | $56,300 |
| 2014 | $129 | $60,500 | $4,000 | $56,500 |
| 2013 | $129 | $60,500 | $4,000 | $56,500 |
Property History
| Date | Event | Price | List to Sale | Price per Sq Ft |
|---|---|---|---|---|
| 10/22/2025 10/22/25 | For Sale | $8,500 | -- | -- |
Purchase History
| Date | Type | Sale Price | Title Company |
|---|---|---|---|
| Quit Claim Deed | -- | None Listed On Document | |
| Quit Claim Deed | -- | None Listed On Document | |
| Deed | $38,500 | -- | |
| Warranty Deed | -- | -- | |
| Interfamily Deed Transfer | -- | -- |
Source: MIBOR Broker Listing Cooperative®
MLS Number: 22069617
APN: 48-11-13-401-276.000-003
Disclaimer: Certain information contained herein is derived from information provided by parties other than Homes.com. All information provided is deemed reliable, but is not guaranteed to be accurate and should be independently verified.
![]() Based on information submitted to the MLS GRID. All data is obtained from various sources and may not have been verified by broker or MLS GRID. Supplied Open House Information is subject to change without notice. All information should be independently reviewed and verified for accuracy. Properties may or may not be listed by the office/agent presenting the information. Some IDX listings have been excluded from this website.
Based on information submitted to the MLS GRID. All data is obtained from various sources and may not have been verified by broker or MLS GRID. Supplied Open House Information is subject to change without notice. All information should be independently reviewed and verified for accuracy. Properties may or may not be listed by the office/agent presenting the information. Some IDX listings have been excluded from this website.
Based on information submitted to the MLS GRID
- 2210 Walnut St Unit B
- 1712 Main St Unit 2
- 1807 Meridian St Unit 4
- 319 E 12th St
- 202 E 13th St Unit 1
- 1212 Meridian St
- 2327 Jackson St Unit 1
- 2327 Jackson St Unit 2
- 222 Dr Martin Luther King jr Blvd Unit MKL #4
- 2710 Fletcher St
- 919 Walnut St Unit B
- 2530 Lincoln St
- 832 E 7th St
- 615 Cottage Ave
- 600 Main St
- 628 Walnut St
- 512 Central Ave
- 3119 Jefferson St
- 2208 Hendricks St Unit 3
- 336 W 7th St Unit .5

Ask me questions while you tour the home.