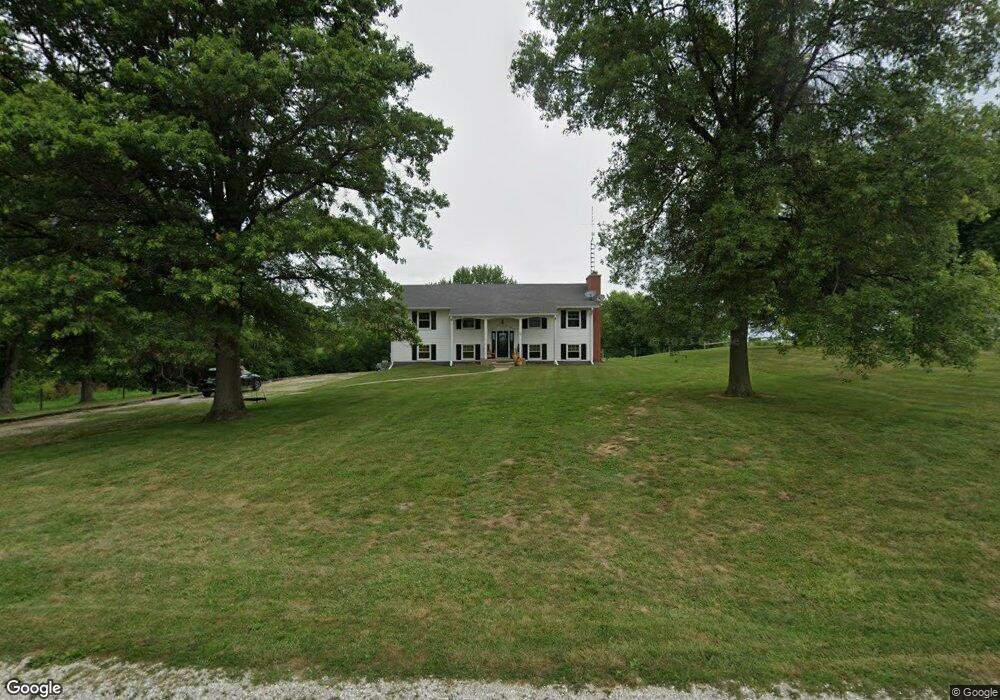
1828 Baldwin Rd Jacksonville, IL 62650
Estimated Value: $209,000 - $231,703
4
Beds
3
Baths
2,279
Sq Ft
$95/Sq Ft
Est. Value
About This Home
This home is located at 1828 Baldwin Rd, Jacksonville, IL 62650 and is currently estimated at $215,926, approximately $94 per square foot. 1828 Baldwin Rd is a home located in Morgan County with nearby schools including Jacksonville High School, Westfair Christian Academy, and Salem Lutheran School.
Ownership History
Date
Name
Owned For
Owner Type
Purchase Details
Closed on
Jul 17, 2009
Sold by
Sellers Janet S
Bought by
Mccaherty Patrick and Mccaherty Megan
Current Estimated Value
Home Financials for this Owner
Home Financials are based on the most recent Mortgage that was taken out on this home.
Original Mortgage
$97,680
Outstanding Balance
$64,333
Interest Rate
5.49%
Mortgage Type
FHA
Estimated Equity
$151,593
Purchase Details
Closed on
Jul 8, 2009
Sold by
Sellers Janet S
Bought by
Pollard Don and Pollard Anne H
Home Financials for this Owner
Home Financials are based on the most recent Mortgage that was taken out on this home.
Original Mortgage
$97,680
Outstanding Balance
$64,333
Interest Rate
5.49%
Mortgage Type
FHA
Estimated Equity
$151,593
Purchase Details
Closed on
Jul 6, 2009
Sold by
Pollard Don and Pollard Anne H
Bought by
Sellers Janet S
Home Financials for this Owner
Home Financials are based on the most recent Mortgage that was taken out on this home.
Original Mortgage
$97,680
Outstanding Balance
$64,333
Interest Rate
5.49%
Mortgage Type
FHA
Estimated Equity
$151,593
Create a Home Valuation Report for This Property
The Home Valuation Report is an in-depth analysis detailing your home's value as well as a comparison with similar homes in the area
Home Values in the Area
Average Home Value in this Area
Purchase History
| Date | Buyer | Sale Price | Title Company |
|---|---|---|---|
| Mccaherty Patrick | $120,000 | None Available | |
| Pollard Don | -- | None Available | |
| Sellers Janet S | -- | None Available |
Source: Public Records
Mortgage History
| Date | Status | Borrower | Loan Amount |
|---|---|---|---|
| Open | Mccaherty Patrick | $97,680 |
Source: Public Records
Tax History Compared to Growth
Tax History
| Year | Tax Paid | Tax Assessment Tax Assessment Total Assessment is a certain percentage of the fair market value that is determined by local assessors to be the total taxable value of land and additions on the property. | Land | Improvement |
|---|---|---|---|---|
| 2024 | $3,824 | $57,530 | $2,500 | $55,030 |
| 2023 | $4,043 | $55,530 | $2,500 | $53,030 |
| 2022 | $3,795 | $51,390 | $3,030 | $48,360 |
| 2021 | $3,586 | $50,050 | $3,030 | $47,020 |
| 2020 | $3,197 | $43,570 | $3,030 | $40,540 |
| 2019 | $2,686 | $36,720 | $3,030 | $33,690 |
| 2018 | $2,568 | $36,060 | $3,030 | $33,030 |
| 2017 | $2,472 | $35,100 | $3,030 | $32,070 |
| 2016 | $2,525 | $35,550 | $2,890 | $32,660 |
| 2015 | $2,526 | $34,520 | $2,810 | $31,710 |
| 2014 | $2,526 | $34,520 | $2,810 | $31,710 |
| 2013 | $2,450 | $34,520 | $2,810 | $31,710 |
Source: Public Records
Map
Nearby Homes
- 70 Applebee Farms Dr
- 8 Wadsworth Dr
- 108 Nansarah Dr
- 1 Wadsworth Dr
- 304 Carobeth Cir
- 1492 Passavant Dr
- 840 W Walnut St
- 610 Sandusky St
- 22 Appomatox Ave
- 6 Fernwood Blvd
- 754 Freedman St
- 33 Windrush Dr
- 1305 W Lafayette Ave
- 858 N Diamond St
- 290 Finley St
- 813 N Diamond St
- 231 N Webster Ave
- 8 Duncan Park
- 715 N Diamond St
- 144 Caldwell St
- 1836 Baldwin Rd
- 1701 Ebenezer Church Rd
- 1822 Baldwin Rd
- 1814 Baldwin Rd
- 1823 Baldwin Rd
- 1810 Baldwin Rd
- 1872 Baldwin Rd
- 1874 Baldwin Rd
- 1880 Baldwin Rd
- 1882 Baldwin Rd
- 1884 Baldwin Rd
- 107 Edlen Ln
- 1886 Baldwin Rd
- 113 Edlen Ln
- 105 Edlen Ln
- 1703 Sandusky Rd
- 1679 Sandusky Rd
- 115 Edlen Ln
- 1665 Sandusky Rd
- 1888 Baldwin Rd