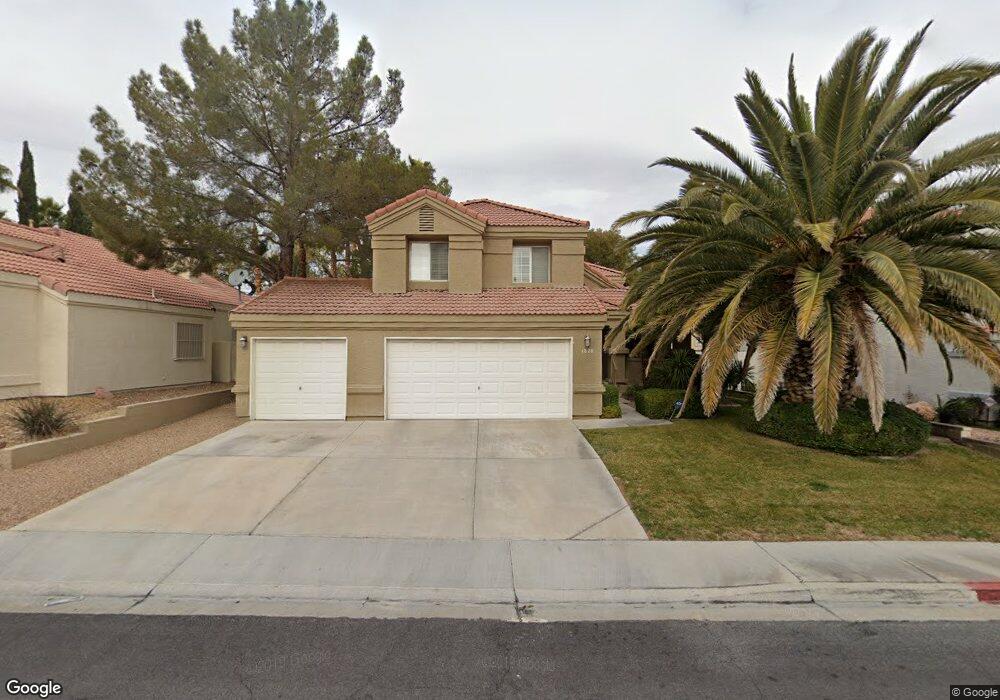
1828 Bogey Way Henderson, NV 89074
Green Valley South NeighborhoodEstimated Value: $515,000 - $596,000
4
Beds
3
Baths
2,266
Sq Ft
$248/Sq Ft
Est. Value
About This Home
This home is located at 1828 Bogey Way, Henderson, NV 89074 and is currently estimated at $561,573, approximately $247 per square foot. 1828 Bogey Way is a home located in Clark County with nearby schools including Selma F Bartlett Elementary School, Barbara and Hank Greenspun Junior High School, and Coronado High School.
Ownership History
Date
Name
Owned For
Owner Type
Purchase Details
Closed on
Dec 14, 2010
Sold by
Cherney Christopher T and Cherney Marnie L
Bought by
Cherney Christopher T and Cherney Marnie L
Current Estimated Value
Purchase Details
Closed on
Jun 12, 2001
Sold by
Huffaker Stephen L and Huffaker Jo Ann
Bought by
Cherney Christopher and Cherney Marnie
Home Financials for this Owner
Home Financials are based on the most recent Mortgage that was taken out on this home.
Original Mortgage
$157,950
Outstanding Balance
$60,166
Interest Rate
7.14%
Estimated Equity
$501,407
Purchase Details
Closed on
May 28, 1993
Sold by
Wallis Baird Drake
Bought by
Huffaker Stephen L and Huffaker Joann
Home Financials for this Owner
Home Financials are based on the most recent Mortgage that was taken out on this home.
Original Mortgage
$124,000
Interest Rate
7.19%
Create a Home Valuation Report for This Property
The Home Valuation Report is an in-depth analysis detailing your home's value as well as a comparison with similar homes in the area
Home Values in the Area
Average Home Value in this Area
Purchase History
| Date | Buyer | Sale Price | Title Company |
|---|---|---|---|
| Cherney Christopher T | -- | None Available | |
| Cherney Christopher | $175,500 | Old Republic Title Company | |
| Huffaker Stephen L | $155,000 | United Title |
Source: Public Records
Mortgage History
| Date | Status | Borrower | Loan Amount |
|---|---|---|---|
| Open | Cherney Christopher | $157,950 | |
| Previous Owner | Huffaker Stephen L | $124,000 |
Source: Public Records
Tax History Compared to Growth
Tax History
| Year | Tax Paid | Tax Assessment Tax Assessment Total Assessment is a certain percentage of the fair market value that is determined by local assessors to be the total taxable value of land and additions on the property. | Land | Improvement |
|---|---|---|---|---|
| 2025 | $2,517 | $105,037 | $41,650 | $63,387 |
| 2024 | $2,331 | $105,037 | $41,650 | $63,387 |
| 2023 | $2,331 | $102,881 | $42,000 | $60,881 |
| 2022 | $2,159 | $90,990 | $35,000 | $55,990 |
| 2021 | $1,999 | $88,663 | $35,000 | $53,663 |
| 2020 | $1,853 | $88,535 | $35,000 | $53,535 |
| 2019 | $1,737 | $77,530 | $24,500 | $53,030 |
| 2018 | $1,658 | $71,014 | $19,950 | $51,064 |
| 2017 | $2,065 | $71,249 | $19,250 | $51,999 |
| 2016 | $1,552 | $66,131 | $13,650 | $52,481 |
| 2015 | $1,549 | $60,090 | $11,200 | $48,890 |
| 2014 | $1,500 | $50,251 | $11,200 | $39,051 |
Source: Public Records
Map
Nearby Homes
- 53 Grossinger Ct
- 1867 Indian Bend Dr
- 56 Grossinger Ct
- 17 Sandwedge Dr
- 104 Augusta Place
- 1910 Grey Eagle St
- 75 N Valle Verde Dr Unit 524
- 75 N Valle Verde Dr Unit 1822
- 75 N Valle Verde Dr Unit 2121
- 75 N Valle Verde Dr Unit 225
- 75 N Valle Verde Dr Unit 211
- 75 N Valle Verde Dr Unit 621
- 1745 Sand Storm Dr
- 69 Incline Village Ct
- 108 Broken Rock Dr
- 54 Ancient Hills Ln
- 2008 Spruce Brook Dr
- 174 Wentworth Dr
- 1832 Poetic Valley Cir
- 2032 Troon Dr
- 1826 Bogey Way
- 1830 Bogey Way
- 1824 Bogey Way
- 1832 Bogey Way
- 1829 Bogey Way
- 1829 Bogey Way Unit na
- 1831 Bogey Way
- 1825 Bogey Way
- 1822 Bogey Way
- 1834 Bogey Way
- 46 Nightshade Ct
- 1823 Bogey Way
- 1831 Indian Bend Dr
- 1837 Indian Bend Dr
- 1820 Bogey Way
- 43 Caddy Cir
- 1829 Indian Bend Dr
- 1821 Bogey Way
- 42 Caddy Cir
- 1836 Bogey Way