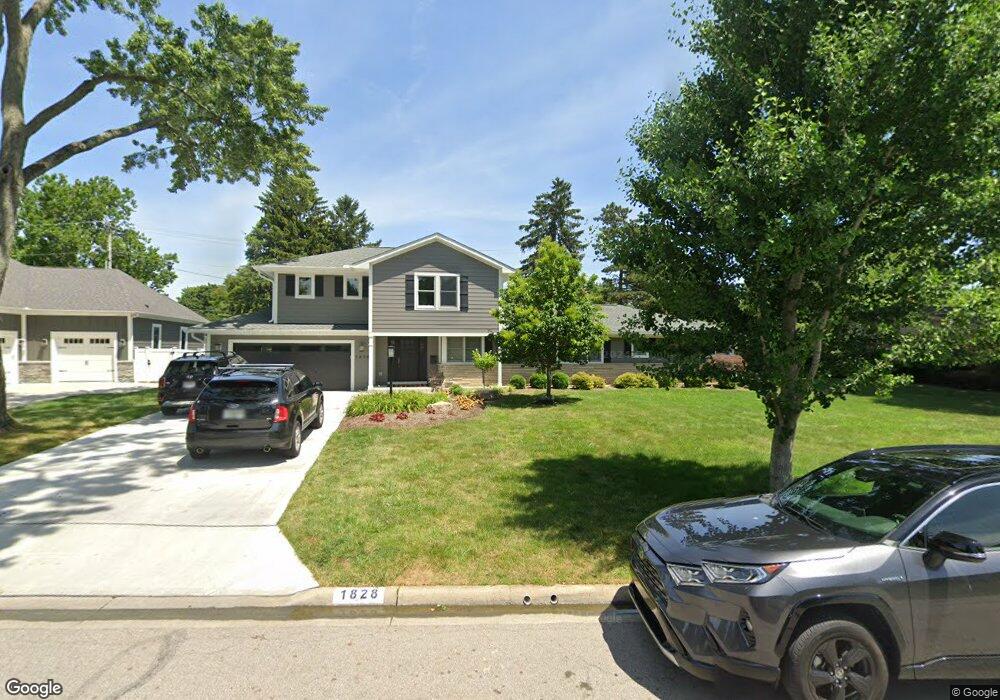
1828 Harwitch Rd Columbus, OH 43221
Estimated Value: $620,000 - $802,365
3
Beds
3
Baths
2,028
Sq Ft
$361/Sq Ft
Est. Value
About This Home
This home is located at 1828 Harwitch Rd, Columbus, OH 43221 and is currently estimated at $732,841, approximately $361 per square foot. 1828 Harwitch Rd is a home located in Franklin County with nearby schools including Tremont Elementary School, Jones Middle School, and Upper Arlington High School.
Ownership History
Date
Name
Owned For
Owner Type
Purchase Details
Closed on
Feb 28, 2005
Sold by
Thorpe Caborn David A and Thorpe Caborn Leslie
Bought by
Lynch James M and Lynch Kimberly L
Current Estimated Value
Purchase Details
Closed on
Jun 28, 1993
Bought by
Caborn David A and Caborn Leslie T
Purchase Details
Closed on
Oct 31, 1989
Purchase Details
Closed on
Oct 23, 1989
Create a Home Valuation Report for This Property
The Home Valuation Report is an in-depth analysis detailing your home's value as well as a comparison with similar homes in the area
Home Values in the Area
Average Home Value in this Area
Purchase History
| Date | Buyer | Sale Price | Title Company |
|---|---|---|---|
| Lynch James M | $249,900 | Title First | |
| Caborn David A | $155,000 | -- | |
| -- | -- | -- | |
| -- | $139,500 | -- |
Source: Public Records
Tax History
| Year | Tax Paid | Tax Assessment Tax Assessment Total Assessment is a certain percentage of the fair market value that is determined by local assessors to be the total taxable value of land and additions on the property. | Land | Improvement |
|---|---|---|---|---|
| 2025 | $13,166 | $227,430 | $70,490 | $156,940 |
| 2024 | $13,166 | $227,430 | $70,490 | $156,940 |
| 2023 | $13,003 | $227,430 | $70,490 | $156,940 |
| 2022 | $19,688 | $220,720 | $57,230 | $163,490 |
| 2021 | $8,552 | $135,840 | $57,230 | $78,610 |
| 2020 | $8,328 | $135,840 | $57,230 | $78,610 |
| 2019 | $7,941 | $114,320 | $57,230 | $57,090 |
| 2018 | $6,858 | $114,320 | $57,230 | $57,090 |
| 2017 | $6,766 | $114,320 | $57,230 | $57,090 |
| 2016 | $5,665 | $85,680 | $31,640 | $54,040 |
| 2015 | $5,660 | $85,680 | $31,640 | $54,040 |
| 2014 | $5,667 | $85,680 | $31,640 | $54,040 |
| 2013 | $2,976 | $85,680 | $31,640 | $54,040 |
Source: Public Records
Map
Nearby Homes
- 3106 Somerford Rd
- 2026 Jervis Rd
- 3175 Tremont Rd Unit 313
- 1744 Ridgecliff Rd Unit 12
- 1842 Ridgecliff Rd
- 2748 Tremont Rd
- 2583 Wexford Rd
- 2227 Zollinger Rd
- 2979 Avalon Rd
- 1530 Pemberton Dr
- 1489 Westminster Dr
- 2367 Southway Dr
- 1869 Tewksbury Rd
- 1565 Berkshire Rd
- 1379 La Rochelle Dr Unit 19C
- 1068 Shady Hill Dr
- 3336 Mansion Way
- 3701 Reed Rd
- 3190 Kenny Rd
- 3163 S Dorchester Rd
- 1816 Harwitch Rd
- 1840 Harwitch Rd
- 1825 Inchcliff Rd
- 1833 Inchcliff Rd
- 1817 Inchcliff Rd
- 1833 Harwitch Rd
- 1807 Inchcliff Rd
- 1806 Harwitch Rd
- 1854 Harwitch Rd
- 1845 Harwitch Rd
- 1821 Harwitch Rd
- 1849 Inchcliff Rd
- 1797 Inchcliff Rd
- 1857 Harwitch Rd
- 1794 Harwitch Rd
- 1868 Harwitch Rd
- 1857 Inchcliff Rd
- 1787 Inchcliff Rd
- 1815 Harwitch Rd
- 2992 Sudbury Rd
Your Personal Tour Guide
Ask me questions while you tour the home.