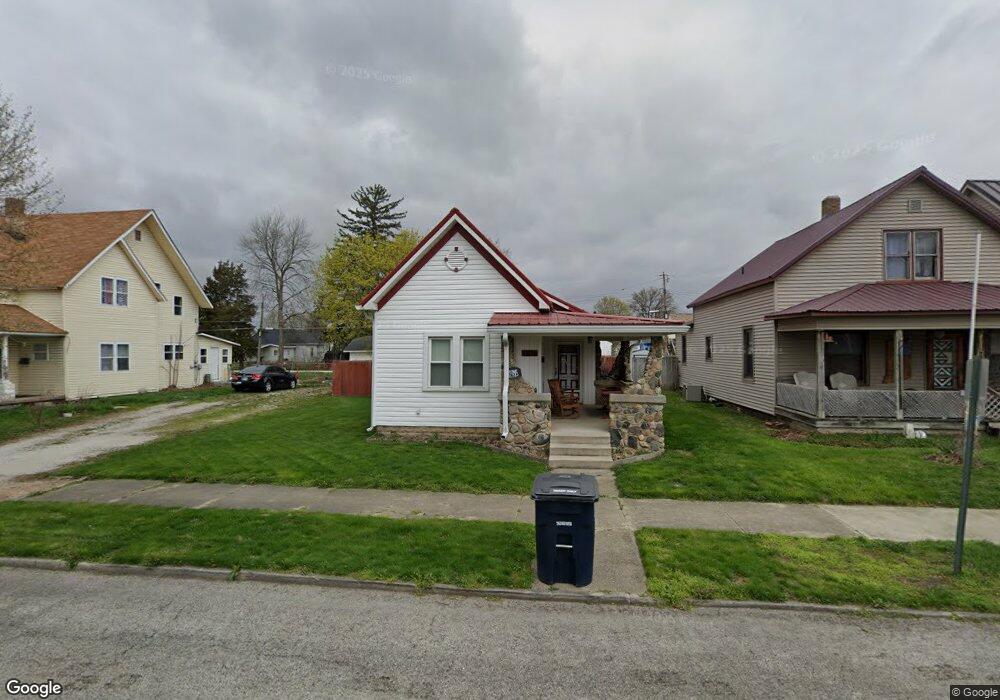
1828 N B St Elwood, IN 46036
Estimated Value: $100,000 - $133,099
2
Beds
1
Bath
889
Sq Ft
$136/Sq Ft
Est. Value
About This Home
This home is located at 1828 N B St, Elwood, IN 46036 and is currently estimated at $120,775, approximately $135 per square foot. 1828 N B St is a home located in Madison County with nearby schools including Elwood Elementary School, Elwood Intermediate School, and Elwood Junior-Senior High School.
Ownership History
Date
Name
Owned For
Owner Type
Purchase Details
Closed on
Sep 3, 2020
Sold by
Sallee Robert E and Sallee Kathy
Bought by
Kinser Dale W
Current Estimated Value
Home Financials for this Owner
Home Financials are based on the most recent Mortgage that was taken out on this home.
Original Mortgage
$78,787
Outstanding Balance
$69,574
Interest Rate
3%
Mortgage Type
New Conventional
Estimated Equity
$51,201
Purchase Details
Closed on
Mar 29, 2007
Sold by
Wells Fargo Financial Indiana Na
Bought by
Sallee Bud and Sallee Kathy
Purchase Details
Closed on
Nov 17, 2006
Sold by
King Jeffrey L
Bought by
Wells Fargo Financial In
Create a Home Valuation Report for This Property
The Home Valuation Report is an in-depth analysis detailing your home's value as well as a comparison with similar homes in the area
Home Values in the Area
Average Home Value in this Area
Purchase History
| Date | Buyer | Sale Price | Title Company |
|---|---|---|---|
| Kinser Dale W | -- | None Available | |
| Sallee Bud | -- | -- | |
| Wells Fargo Financial In | $36,000 | -- |
Source: Public Records
Mortgage History
| Date | Status | Borrower | Loan Amount |
|---|---|---|---|
| Open | Kinser Dale W | $78,787 |
Source: Public Records
Tax History Compared to Growth
Tax History
| Year | Tax Paid | Tax Assessment Tax Assessment Total Assessment is a certain percentage of the fair market value that is determined by local assessors to be the total taxable value of land and additions on the property. | Land | Improvement |
|---|---|---|---|---|
| 2025 | $914 | $91,400 | $7,700 | $83,700 |
| 2024 | $914 | $91,400 | $7,700 | $83,700 |
| 2023 | $835 | $83,300 | $7,400 | $75,900 |
| 2022 | $837 | $82,800 | $6,900 | $75,900 |
| 2021 | $739 | $74,000 | $6,700 | $67,300 |
| 2020 | $290 | $33,800 | $6,200 | $27,600 |
| 2019 | $675 | $33,200 | $6,200 | $27,000 |
| 2018 | $645 | $31,700 | $6,200 | $25,500 |
| 2017 | $639 | $31,900 | $6,200 | $25,700 |
| 2016 | $618 | $30,600 | $6,000 | $24,600 |
| 2014 | $893 | $44,600 | $6,200 | $38,400 |
| 2013 | $893 | $45,000 | $6,200 | $38,800 |
Source: Public Records
Map
Nearby Homes