1828 SE 21st St Unit 89 Cape Coral, FL 33990
Hancock NeighborhoodEstimated Value: $628,606 - $721,000
3
Beds
2
Baths
1,978
Sq Ft
$343/Sq Ft
Est. Value
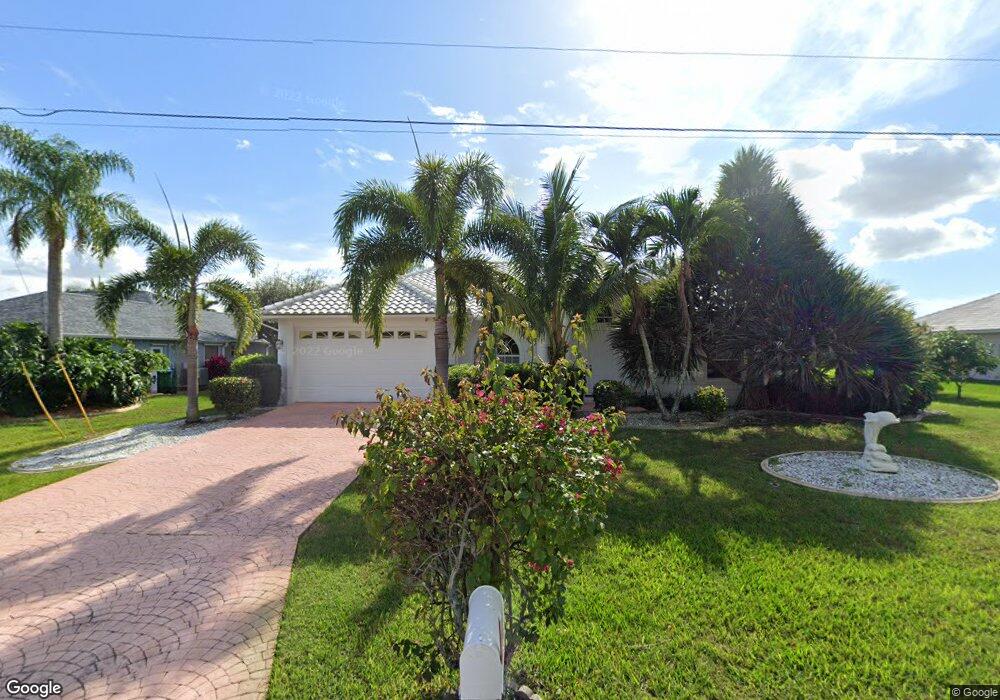
About This Home
This home is located at 1828 SE 21st St Unit 89, Cape Coral, FL 33990 and is currently estimated at $679,152, approximately $343 per square foot. 1828 SE 21st St Unit 89 is a home located in Lee County with nearby schools including Caloosa Elementary School, Cape Elementary School, and Tropic Isles Elementary School.
Ownership History
Date
Name
Owned For
Owner Type
Purchase Details
Closed on
Oct 20, 2010
Sold by
Hartich Roland and Hartich Shannon
Bought by
Huenecke Christian and Huenecke Brigitte
Current Estimated Value
Purchase Details
Closed on
Apr 26, 2002
Sold by
Cramer Charles A and Cramer Nancy J
Bought by
Hartich Roland and Hartich Shannon
Home Financials for this Owner
Home Financials are based on the most recent Mortgage that was taken out on this home.
Original Mortgage
$292,000
Interest Rate
7.12%
Purchase Details
Closed on
May 22, 2001
Sold by
Sakar Tahsin and Sakar Brigitte
Bought by
Cramer Charles A and Cramer Nancy J
Home Financials for this Owner
Home Financials are based on the most recent Mortgage that was taken out on this home.
Original Mortgage
$268,000
Interest Rate
7.06%
Purchase Details
Closed on
Mar 29, 1996
Sold by
Widmer Niklaus and Widmer Bertha
Bought by
Sakar Tahsin and Sakar Brigitte
Create a Home Valuation Report for This Property
The Home Valuation Report is an in-depth analysis detailing your home's value as well as a comparison with similar homes in the area
Home Values in the Area
Average Home Value in this Area
Purchase History
| Date | Buyer | Sale Price | Title Company |
|---|---|---|---|
| Huenecke Christian | $350,000 | Stewart Title Company | |
| Hartich Roland | $365,000 | -- | |
| Cramer Charles A | $335,000 | -- | |
| Sakar Tahsin | $59,000 | -- |
Source: Public Records
Mortgage History
| Date | Status | Borrower | Loan Amount |
|---|---|---|---|
| Previous Owner | Hartich Roland | $292,000 | |
| Previous Owner | Cramer Charles A | $268,000 |
Source: Public Records
Tax History Compared to Growth
Tax History
| Year | Tax Paid | Tax Assessment Tax Assessment Total Assessment is a certain percentage of the fair market value that is determined by local assessors to be the total taxable value of land and additions on the property. | Land | Improvement |
|---|---|---|---|---|
| 2025 | $9,870 | $604,677 | -- | -- |
| 2024 | $9,262 | $549,706 | -- | -- |
| 2023 | $9,262 | $499,733 | $0 | $0 |
| 2022 | $8,839 | $454,303 | $0 | $0 |
| 2021 | $7,841 | $413,003 | $124,483 | $288,520 |
| 2020 | $7,448 | $375,489 | $138,000 | $237,489 |
| 2019 | $7,046 | $355,294 | $138,000 | $217,294 |
| 2018 | $7,512 | $372,263 | $126,500 | $245,763 |
| 2017 | $7,150 | $345,599 | $110,400 | $235,199 |
| 2016 | $7,034 | $337,183 | $125,062 | $212,121 |
| 2015 | $6,729 | $313,809 | $121,337 | $192,472 |
| 2014 | $6,922 | $315,309 | $92,834 | $222,475 |
| 2013 | -- | $329,902 | $94,497 | $235,405 |
Source: Public Records
Map
Nearby Homes
- 1822 SE 20th St
- 2118 SE 18th Ave
- 2017 SE 17th Place
- 2127 SE 17th Place
- 2201 SE 17th Place
- 2214 SE 19th Place
- 1814 Four Mile Cove Pkwy
- 2143 SE 18th Place
- 1705 SE 21st Terrace
- 2213 SE 17th Place
- 1630 SE 20th St
- 1944 Four Mile Cove Pkwy
- 1705 SE 19th Ln
- 2027 SE 21st St
- 1621 SE 21st Terrace
- 1763 Four Mile Cove Pkwy Unit 611
- 2031 SE 21st St
- 1622 SE 20th St
- 2310 SE 18th Ave
- 2314 SE 18th Ave
- 1822 SE 21st St
- 1827 SE 21st St
- 1823 SE 21st St
- 1829 SE 21st Terrace
- 1825 SE 21st Terrace Unit 89
- 1901 SE 21st St
- 1819 SE 21st St
- 1901 SE 21st Terrace
- 1821 SE 21st Terrace
- 1814 SE 21st St
- 1910 SE 21st St
- 1905 SE 21st St
- 1815 SE 21st St
- 1905 SE 21st Terrace
- 1824 SE 20th Ln Unit 11
- 1824 SE 20th Ln
- 1828 SE 20th Ln
- 1818 SE 20th Ln
- 1909 SE 21st Terrace
- 1810 SE 21st St