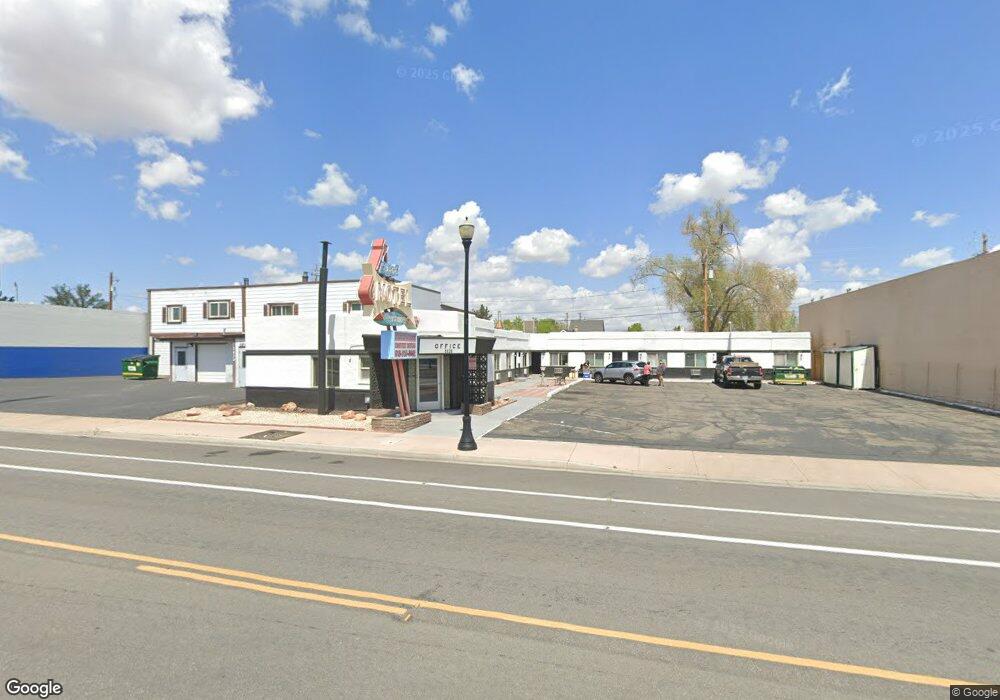
1828 Victorian Ave Sparks, NV 89431
Downtown Sparks NeighborhoodEstimated Value: $859,341
--
Bed
1
Bath
320
Sq Ft
$2,685/Sq Ft
Est. Value
About This Home
This home is located at 1828 Victorian Ave, Sparks, NV 89431 and is currently priced at $859,341, approximately $2,685 per square foot. 1828 Victorian Ave is a home located in Washoe County with nearby schools including Robert Mitchell Elementary School, Sparks Middle School, and Sparks High School.
Ownership History
Date
Name
Owned For
Owner Type
Purchase Details
Closed on
Jul 14, 2022
Sold by
Loren Zaleschuk
Bought by
Irg Victorian Llc
Current Estimated Value
Home Financials for this Owner
Home Financials are based on the most recent Mortgage that was taken out on this home.
Original Mortgage
$2,276,000
Outstanding Balance
$2,165,354
Interest Rate
5.09%
Mortgage Type
New Conventional
Purchase Details
Closed on
Mar 5, 2018
Sold by
Zeleschuk Loren
Bought by
Hauslbauer Loren
Create a Home Valuation Report for This Property
The Home Valuation Report is an in-depth analysis detailing your home's value as well as a comparison with similar homes in the area
Home Values in the Area
Average Home Value in this Area
Purchase History
| Date | Buyer | Sale Price | Title Company |
|---|---|---|---|
| Irg Victorian Llc | $850,000 | First American Title | |
| Hauslbauer Loren | -- | None Available |
Source: Public Records
Mortgage History
| Date | Status | Borrower | Loan Amount |
|---|---|---|---|
| Open | Irg Victorian Llc | $2,276,000 |
Source: Public Records
Tax History Compared to Growth
Tax History
| Year | Tax Paid | Tax Assessment Tax Assessment Total Assessment is a certain percentage of the fair market value that is determined by local assessors to be the total taxable value of land and additions on the property. | Land | Improvement |
|---|---|---|---|---|
| 2025 | $3,162 | $97,648 | $45,280 | $52,368 |
| 2024 | $2,950 | $92,082 | $39,106 | $52,976 |
| 2023 | $2,950 | $84,274 | $39,106 | $45,168 |
| 2022 | $2,748 | $73,884 | $37,047 | $36,837 |
| 2021 | $2,557 | $67,955 | $30,873 | $37,082 |
| 2020 | $2,532 | $68,270 | $30,873 | $37,397 |
| 2019 | $2,436 | $65,657 | $30,873 | $34,784 |
| 2018 | $2,419 | $64,910 | $30,873 | $34,037 |
| 2017 | $2,413 | $64,729 | $30,873 | $33,856 |
| 2016 | $2,397 | $64,494 | $30,873 | $33,621 |
| 2015 | $626 | $64,229 | $30,873 | $33,356 |
| 2014 | $2,349 | $62,945 | $30,873 | $32,072 |
| 2013 | -- | $61,707 | $30,873 | $30,834 |
Source: Public Records
Map
Nearby Homes