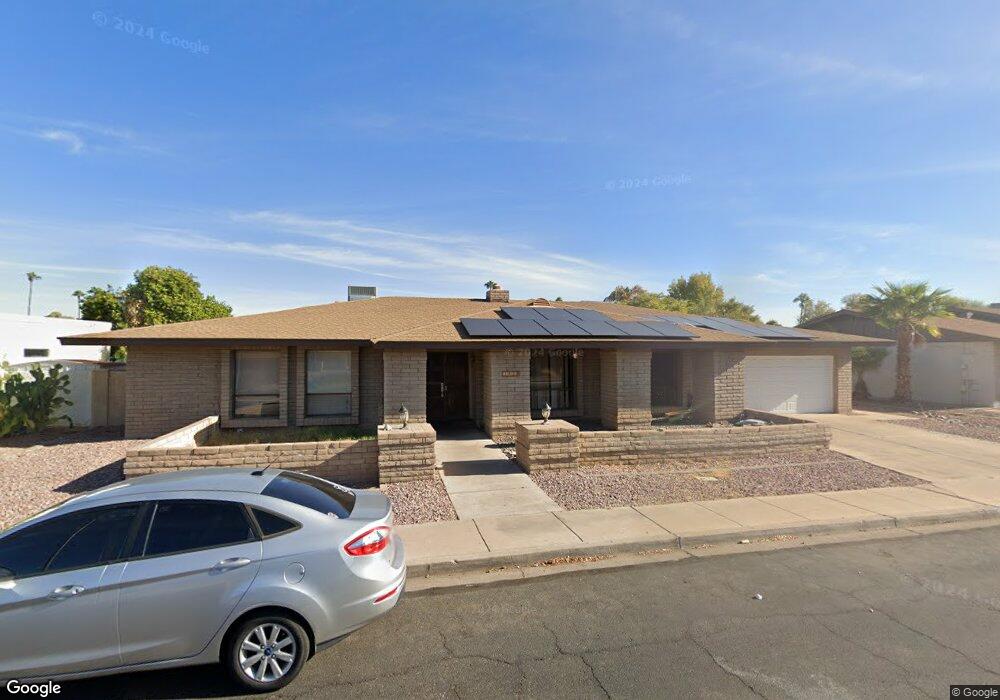
1828 W Navarro Ave Mesa, AZ 85202
Dobson NeighborhoodEstimated Value: $564,217 - $740,000
--
Bed
3
Baths
2,885
Sq Ft
$224/Sq Ft
Est. Value
About This Home
This home is located at 1828 W Navarro Ave, Mesa, AZ 85202 and is currently estimated at $646,054, approximately $223 per square foot. 1828 W Navarro Ave is a home located in Maricopa County with nearby schools including Franklin at Brimhall Elementary School, Franklin Accelerated Academy Jordan Campus, and Washington Elementary School.
Ownership History
Date
Name
Owned For
Owner Type
Purchase Details
Closed on
Jul 7, 2021
Sold by
Romers William D and Romers Maria Delourdes
Bought by
Romers William D and Romers Maria Delourdes
Current Estimated Value
Home Financials for this Owner
Home Financials are based on the most recent Mortgage that was taken out on this home.
Original Mortgage
$350,493
Interest Rate
2.9%
Mortgage Type
VA
Purchase Details
Closed on
Feb 2, 2007
Sold by
Romers William D
Bought by
Romers William Dean and Romers Maria Delourdes
Purchase Details
Closed on
Mar 28, 2002
Sold by
Romers William D and Nelson Josephine F
Bought by
Romers William D
Purchase Details
Closed on
Aug 18, 1997
Sold by
Nelson Josephine F and Nelson Josephine R
Bought by
Romers William D and Nelson Josephine F
Create a Home Valuation Report for This Property
The Home Valuation Report is an in-depth analysis detailing your home's value as well as a comparison with similar homes in the area
Home Values in the Area
Average Home Value in this Area
Purchase History
| Date | Buyer | Sale Price | Title Company |
|---|---|---|---|
| Romers William D | -- | Vantage Point Title | |
| Romers William Dean | -- | None Available | |
| Romers William D | -- | First American Title | |
| Romers William D | -- | Stewart Title & Trust |
Source: Public Records
Mortgage History
| Date | Status | Borrower | Loan Amount |
|---|---|---|---|
| Closed | Romers William D | $350,493 |
Source: Public Records
Tax History Compared to Growth
Tax History
| Year | Tax Paid | Tax Assessment Tax Assessment Total Assessment is a certain percentage of the fair market value that is determined by local assessors to be the total taxable value of land and additions on the property. | Land | Improvement |
|---|---|---|---|---|
| 2025 | $2,369 | $28,522 | -- | -- |
| 2024 | $2,394 | $27,164 | -- | -- |
| 2023 | $2,394 | $45,570 | $9,110 | $36,460 |
| 2022 | $2,342 | $34,500 | $6,900 | $27,600 |
| 2021 | $2,406 | $32,010 | $6,400 | $25,610 |
| 2020 | $2,374 | $30,810 | $6,160 | $24,650 |
| 2019 | $2,199 | $28,710 | $5,740 | $22,970 |
| 2018 | $2,100 | $27,300 | $5,460 | $21,840 |
| 2017 | $2,034 | $26,280 | $5,250 | $21,030 |
| 2016 | $1,997 | $27,220 | $5,440 | $21,780 |
| 2015 | $1,885 | $24,600 | $4,920 | $19,680 |
Source: Public Records
Map
Nearby Homes
- 2722 S Pennington
- 2637 S El Paradiso
- 1639 W Nido Ave
- 2043 W Nopal Ave
- 1910 W Onza Ave
- 2524 S El Paradiso Unit 22
- 2524 S El Paradiso Unit 32
- 2524 S El Paradiso Unit 50
- 2937 S Pennington
- 1555 W Naranja Ave
- 1853 W Plata Ave
- 2958 S El Paradiso
- 2554 S Salida Del Sol
- 1531 W Naranja Ave
- 2030 W Portobello Ave
- 2741 S Brooks --
- 2406 S Mulberry
- 2309 W Naranja Ave
- 1358 W Lobo Ave
- 1920 W Linder Ave Unit 229
- 1834 W Navarro Ave
- 1822 W Navarro Ave
- 1833 W Keating Ave
- 1839 W Keating Ave
- 1825 W Keating Ave
- 1829 W Navarro Ave
- 2733 S Cholla Cir
- 1840 W Navarro Ave
- 1816 W Navarro Ave
- 1843 W Keating Ave
- 1837 W Navarro Ave
- 1817 W Navarro Ave
- 1815 W Keating Ave
- 2739 S Cholla Cir
- 2738 S Cholla Cir
- 1849 W Keating Ave
- 1832 W Keating Ave
- 1846 W Navarro Ave
- 1838 W Keating Ave
- 1841 W Navarro Ave