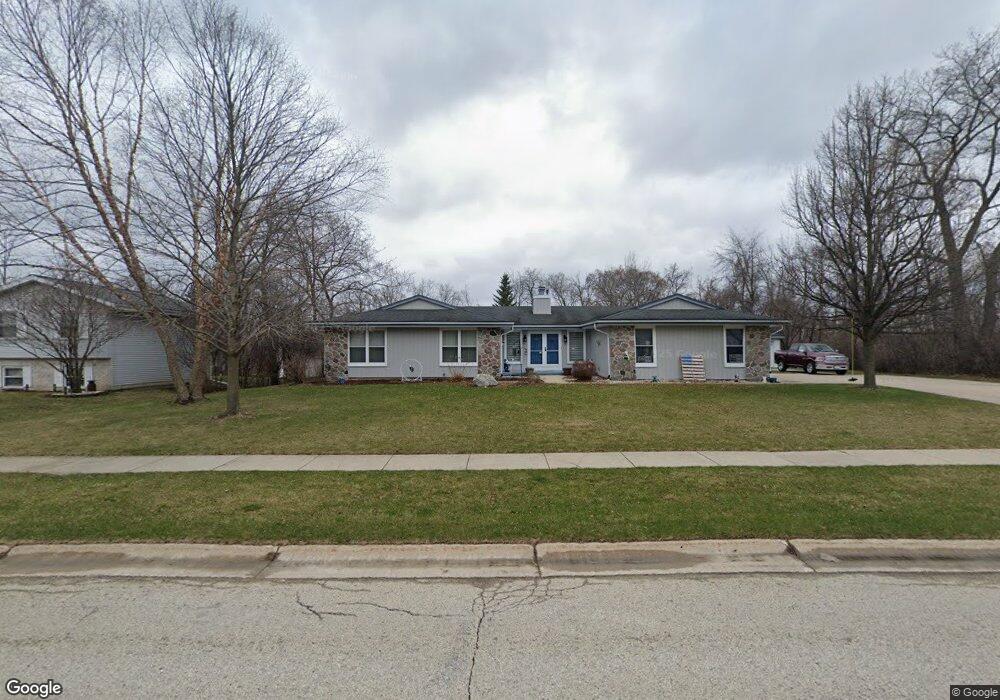
18287 Lions Park Dr Muskego, WI 53150
Estimated Value: $554,222 - $637,000
3
Beds
4
Baths
2,200
Sq Ft
$269/Sq Ft
Est. Value
About This Home
This home is located at 18287 Lions Park Dr, Muskego, WI 53150 and is currently estimated at $592,306, approximately $269 per square foot. 18287 Lions Park Dr is a home located in Waukesha County with nearby schools including Muskego Lakes Middle School, Muskego High School, and St. Leonard School.
Ownership History
Date
Name
Owned For
Owner Type
Purchase Details
Closed on
Oct 5, 2018
Sold by
Leyns Karen B and Karen B Leyns Revocable Trust
Bought by
Cherly Neil R and Cherly Tawnn M
Current Estimated Value
Home Financials for this Owner
Home Financials are based on the most recent Mortgage that was taken out on this home.
Original Mortgage
$331,000
Outstanding Balance
$288,652
Interest Rate
4.5%
Mortgage Type
New Conventional
Estimated Equity
$303,654
Purchase Details
Closed on
May 19, 2017
Sold by
Leyns Karen B
Bought by
Karen B Leyns Revocable Trust
Purchase Details
Closed on
May 24, 2002
Sold by
Fleury Claude M and Fleury Donna J
Bought by
Leyns Charles K and Leyns Karen B
Home Financials for this Owner
Home Financials are based on the most recent Mortgage that was taken out on this home.
Original Mortgage
$80,000
Interest Rate
6.95%
Create a Home Valuation Report for This Property
The Home Valuation Report is an in-depth analysis detailing your home's value as well as a comparison with similar homes in the area
Home Values in the Area
Average Home Value in this Area
Purchase History
| Date | Buyer | Sale Price | Title Company |
|---|---|---|---|
| Cherly Neil R | $350,000 | None Available | |
| Karen B Leyns Revocable Trust | -- | None Available | |
| Leyns Charles K | $242,400 | -- |
Source: Public Records
Mortgage History
| Date | Status | Borrower | Loan Amount |
|---|---|---|---|
| Open | Cherly Neil R | $331,000 | |
| Previous Owner | Leyns Charles K | $80,000 |
Source: Public Records
Tax History Compared to Growth
Tax History
| Year | Tax Paid | Tax Assessment Tax Assessment Total Assessment is a certain percentage of the fair market value that is determined by local assessors to be the total taxable value of land and additions on the property. | Land | Improvement |
|---|---|---|---|---|
| 2024 | $4,389 | $382,800 | $67,600 | $315,200 |
| 2023 | $4,336 | $382,800 | $67,600 | $315,200 |
| 2022 | $4,234 | $382,800 | $67,600 | $315,200 |
| 2021 | $4,198 | $382,800 | $67,600 | $315,200 |
| 2020 | $4,085 | $294,000 | $59,300 | $234,700 |
| 2019 | $4,054 | $294,000 | $59,300 | $234,700 |
| 2018 | $4,101 | $294,000 | $59,300 | $234,700 |
| 2017 | $4,799 | $294,000 | $59,300 | $234,700 |
| 2016 | $3,925 | $251,400 | $56,800 | $194,600 |
| 2015 | $3,964 | $251,400 | $56,800 | $194,600 |
| 2014 | $4,315 | $251,400 | $56,800 | $194,600 |
| 2013 | $4,315 | $251,400 | $56,800 | $194,600 |
Source: Public Records
Map
Nearby Homes
- W179S7953 Scenic Dr
- W186S7576 Kingston Dr
- W188S7634 Oak Grove Dr
- W188S7598 Oak Grove Dr
- S75W17553 Harbor Cir Unit 1B
- W177S7495 Harbor Cir Unit 6D
- S76W19414 Prospect Dr
- S83W17591 Cedarcrest Ln
- Lt4 Lannon Dr
- W169S7647 Gregory Dr Unit D
- S73W17268 Lake Dr
- W171S7452 Lannon Dr
- S78W16730 Spinnaker Dr
- W170S7361 Parkland Dr Unit 13
- S75W16788 Jacob Ct Unit 12
- W169S7219 Avon Ct
- S70W19133 Kenwood Dr
- S88W17993 Edgewater Heights Way
- W163S7358 Bay Lane Dr
- S70W20099 Adrian Dr
- S78W18287 Lions Park Dr
- S78W18253 Lions Park Dr
- S78W18288 Lions Park Dr
- S78W18225 Lions Park Dr
- S78W18264 Lions Park Dr
- W183S7832 Kelly Dr
- W183S7882 Kelly Dr
- W183S7834 Kelly Dr
- W183S7884 Kelly Dr
- S78W18232 Lions Park Dr
- W183S7863 Kelly Dr
- S78W18221 Lions Park Dr
- S78W18197 Lions Park Dr
- S78W18206 Lions Park Dr
- W183S7879 Kelly Dr
- S78W18384 Lions Park Dr
- W183S7808 Kelly Dr
- W182S7791 Ann Dr
- S77W18245 Ann Dr
- S78W18155 Lions Park Dr