1829 Bering Dr Unit 13 Houston, TX 77057
Uptown-Galleria District NeighborhoodEstimated Value: $329,000 - $368,000
3
Beds
3
Baths
1,845
Sq Ft
$187/Sq Ft
Est. Value
About This Home
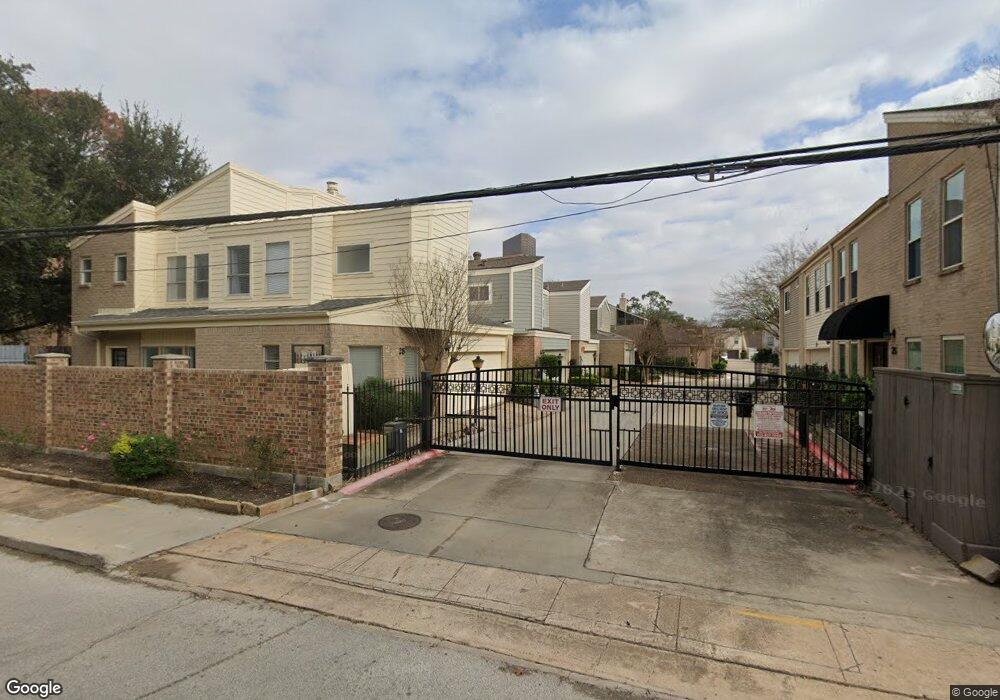
This home is located at 1829 Bering Dr Unit 13, Houston, TX 77057 and is currently estimated at $345,061, approximately $187 per square foot. 1829 Bering Dr Unit 13 is a home located in Harris County with nearby schools including Briargrove Elementary School, Tanglewood Middle, and Wisdom High School.
Ownership History
Date
Name
Owned For
Owner Type
Purchase Details
Closed on
Feb 27, 2020
Sold by
Li Xiaoying
Bought by
Linscombe Justin
Current Estimated Value
Home Financials for this Owner
Home Financials are based on the most recent Mortgage that was taken out on this home.
Original Mortgage
$260,000
Outstanding Balance
$230,702
Interest Rate
3.6%
Mortgage Type
New Conventional
Estimated Equity
$114,359
Purchase Details
Closed on
Feb 14, 2011
Sold by
Bessiere Suzette
Bought by
Li Xiaoying
Home Financials for this Owner
Home Financials are based on the most recent Mortgage that was taken out on this home.
Original Mortgage
$187,500
Interest Rate
4.79%
Mortgage Type
New Conventional
Purchase Details
Closed on
Sep 4, 1998
Sold by
Ralston Scott Andrew and Ralston Diane
Bought by
Bessiere Pierre and Bessiere Suzanne
Create a Home Valuation Report for This Property
The Home Valuation Report is an in-depth analysis detailing your home's value as well as a comparison with similar homes in the area
Home Values in the Area
Average Home Value in this Area
Purchase History
| Date | Buyer | Sale Price | Title Company |
|---|---|---|---|
| Linscombe Justin | -- | Tradition Title Company | |
| Li Xiaoying | -- | First American Title | |
| Bessiere Pierre | -- | -- |
Source: Public Records
Mortgage History
| Date | Status | Borrower | Loan Amount |
|---|---|---|---|
| Open | Linscombe Justin | $260,000 | |
| Previous Owner | Li Xiaoying | $187,500 |
Source: Public Records
Tax History Compared to Growth
Tax History
| Year | Tax Paid | Tax Assessment Tax Assessment Total Assessment is a certain percentage of the fair market value that is determined by local assessors to be the total taxable value of land and additions on the property. | Land | Improvement |
|---|---|---|---|---|
| 2025 | $4,759 | $325,170 | $125,000 | $200,170 |
| 2024 | $4,759 | $335,574 | $125,000 | $210,574 |
| 2023 | $4,759 | $319,270 | $125,000 | $194,270 |
| 2022 | $6,869 | $311,941 | $125,000 | $186,941 |
| 2021 | $6,153 | $263,989 | $125,000 | $138,989 |
| 2020 | $6,706 | $276,922 | $125,000 | $151,922 |
| 2019 | $7,007 | $276,922 | $125,000 | $151,922 |
| 2018 | $5,332 | $276,922 | $125,000 | $151,922 |
| 2017 | $7,002 | $276,922 | $125,000 | $151,922 |
| 2016 | $6,895 | $276,922 | $125,000 | $151,922 |
| 2015 | $4,479 | $303,458 | $125,000 | $178,458 |
| 2014 | $4,479 | $225,357 | $50,000 | $175,357 |
Source: Public Records
Map
Nearby Homes
- 1829 Bering Dr Unit 24
- 1829 Bering Dr Unit 6
- 1881 Bering Dr Unit 64
- 1881 Bering Dr Unit 82
- 1881 Bering Dr Unit 67
- 1881 Bering Dr Unit 54
- 1902 Chimney Rock Rd
- 1904 Chimney Rock Rd
- 5659 Willers Way
- 5658 Del Monte Dr
- 2001 Bering Dr Unit 5
- 1829 Augusta Dr Unit 33
- 5626 Willers Way
- 5626 Terwilliger Way
- 2333 Bering Dr Unit 126
- 2333 Bering Dr Unit 311
- 2333 Bering Dr Unit 334
- 5656 San Felipe St Unit 1203
- 5656 San Felipe St Unit 1005
- 5656 San Felipe St Unit 1205
- 1829 Bering Dr
- 1829 Bering Dr
- 1829 Bering Dr
- 1829 Bering Dr Unit 21
- 1829 Bering Dr Unit 3
- 1829 Bering Dr Unit 28
- 1829 Bering Dr Unit 7
- 1829 Bering Dr Unit 5
- 1829 Bering Dr Unit 8
- 1829 Bering Dr Unit 20
- 1829 Bering Dr Unit 14
- 1829 Bering Dr Unit 23
- 1829 Bering Dr Unit 22
- 1829 Bering Dr Unit 19
- 1829 Bering Dr Unit 17
- 1829 Bering Dr
- 1829 Bering Dr Unit 15
- 1829 Bering Dr Unit 12
- 1829 Bering Dr Unit 11
- 1829 Bering Dr Unit 10