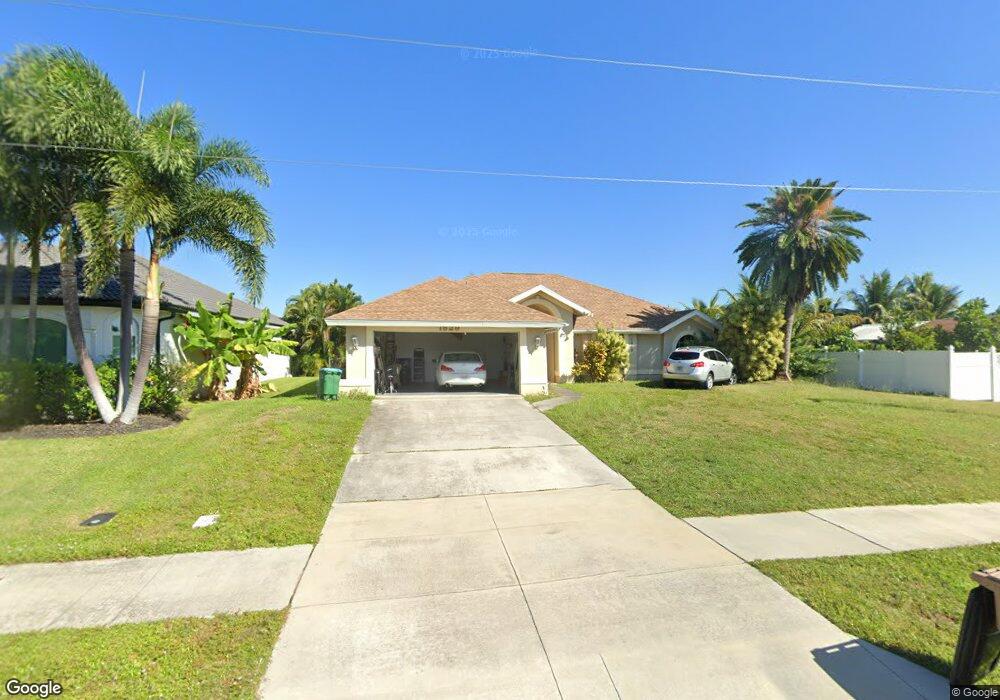
1829 Hancock Bridge Pkwy Cape Coral, FL 33990
Hancock NeighborhoodEstimated Value: $354,000 - $414,000
3
Beds
2
Baths
1,729
Sq Ft
$229/Sq Ft
Est. Value
About This Home
This home is located at 1829 Hancock Bridge Pkwy, Cape Coral, FL 33990 and is currently estimated at $395,276, approximately $228 per square foot. 1829 Hancock Bridge Pkwy is a home located in Lee County with nearby schools including Caloosa Elementary School, Tropic Isles Elementary School, and Hancock Creek Elementary School.
Ownership History
Date
Name
Owned For
Owner Type
Purchase Details
Closed on
Apr 16, 2013
Sold by
Johnson Sadie
Bought by
Johnson Sadie and Johnson Julie
Current Estimated Value
Purchase Details
Closed on
Oct 20, 2005
Sold by
Eitel Irene
Bought by
Johnson Sadie
Home Financials for this Owner
Home Financials are based on the most recent Mortgage that was taken out on this home.
Original Mortgage
$230,000
Outstanding Balance
$122,718
Interest Rate
5.71%
Mortgage Type
Fannie Mae Freddie Mac
Estimated Equity
$272,558
Purchase Details
Closed on
Sep 8, 2004
Sold by
Eitel Van Elga and Eitel Irene Laurence
Bought by
Eitel Irene Laurence
Purchase Details
Closed on
May 28, 2004
Sold by
Crussard Paul and Crussard Florserfina
Bought by
Flecha Eliseo A and Flecha Helda Y
Home Financials for this Owner
Home Financials are based on the most recent Mortgage that was taken out on this home.
Original Mortgage
$122,500
Interest Rate
5.89%
Mortgage Type
Unknown
Create a Home Valuation Report for This Property
The Home Valuation Report is an in-depth analysis detailing your home's value as well as a comparison with similar homes in the area
Home Values in the Area
Average Home Value in this Area
Purchase History
| Date | Buyer | Sale Price | Title Company |
|---|---|---|---|
| Johnson Sadie | -- | None Available | |
| Johnson Sadie | $289,000 | Platinum Land Title Agency I | |
| Eitel Irene Laurence | -- | -- | |
| Flecha Eliseo A | $135,500 | Members Title Agency Llc |
Source: Public Records
Mortgage History
| Date | Status | Borrower | Loan Amount |
|---|---|---|---|
| Open | Johnson Sadie | $230,000 | |
| Previous Owner | Flecha Eliseo A | $122,500 |
Source: Public Records
Tax History Compared to Growth
Tax History
| Year | Tax Paid | Tax Assessment Tax Assessment Total Assessment is a certain percentage of the fair market value that is determined by local assessors to be the total taxable value of land and additions on the property. | Land | Improvement |
|---|---|---|---|---|
| 2025 | $2,219 | $161,309 | -- | -- |
| 2024 | $2,079 | $156,763 | -- | -- |
| 2023 | $2,079 | $152,197 | $0 | $0 |
| 2022 | $1,876 | $147,764 | $0 | $0 |
| 2021 | $1,818 | $245,825 | $47,726 | $198,099 |
| 2020 | $1,802 | $141,479 | $0 | $0 |
| 2019 | $1,733 | $138,298 | $0 | $0 |
| 2018 | $1,704 | $135,719 | $0 | $0 |
| 2017 | $1,678 | $132,928 | $0 | $0 |
| 2016 | $1,616 | $193,957 | $34,010 | $159,947 |
| 2015 | $1,602 | $175,495 | $32,635 | $142,860 |
| 2014 | -- | $166,496 | $28,736 | $137,760 |
| 2013 | -- | $140,208 | $23,560 | $116,648 |
Source: Public Records
Map
Nearby Homes
- 1843 Hancock Bridge Pkwy Unit 30
- 1831 SE van Loon Terrace
- 1813 Hancock Bridge Pkwy
- 2818 NE NE 1st St
- 1802 NE van Loon Terrace
- 2007 NE 20th Ct
- 105 NE 20th Ct
- 109 NE 20th Ct
- 1930 NE 2nd Terrace
- 118 NE 21st Ave
- 207 SE 20th Place
- 1726 SE 2nd St
- 113 NE 16th Place
- 102 NE 16th Place
- 1631 SE 2nd St
- 1519-1531 NE 2nd St
- 1625 NE 2nd St
- 1725 SE 3rd St
- 4105 NE 21st Ave
- 503 NE 21st Ave
- 1829 Hancock Bridge Pkwy
- 1825 Hancock Bridge Pkwy
- 1835 Hancock Bridge Pkwy
- 1821 Hancock Bridge Pkwy
- 1817 Hancock Bridge Pkwy
- 1828 Hancock Bridge Pkwy
- 1824 Hancock Bridge Pkwy
- 1824 NE van Loon Terrace
- 1820 NE van Loon Terrace
- 1832 Hancock Bridge Pkwy
- 1828 NE van Loon Terrace
- 1818 Hancock Bridge Pkwy
- 1836 Hancock Bridge Pkwy
- 1814 NE van Loon Terrace
- 1814 Hancock Bridge Pkwy
- 1827 SE van Loon Terrace
- 1823 SE van Loon Terrace
- 1903 Hancock Bridge Pkwy
- 1840 Hancock Bridge Pkwy
- 8 NE 19th Ct