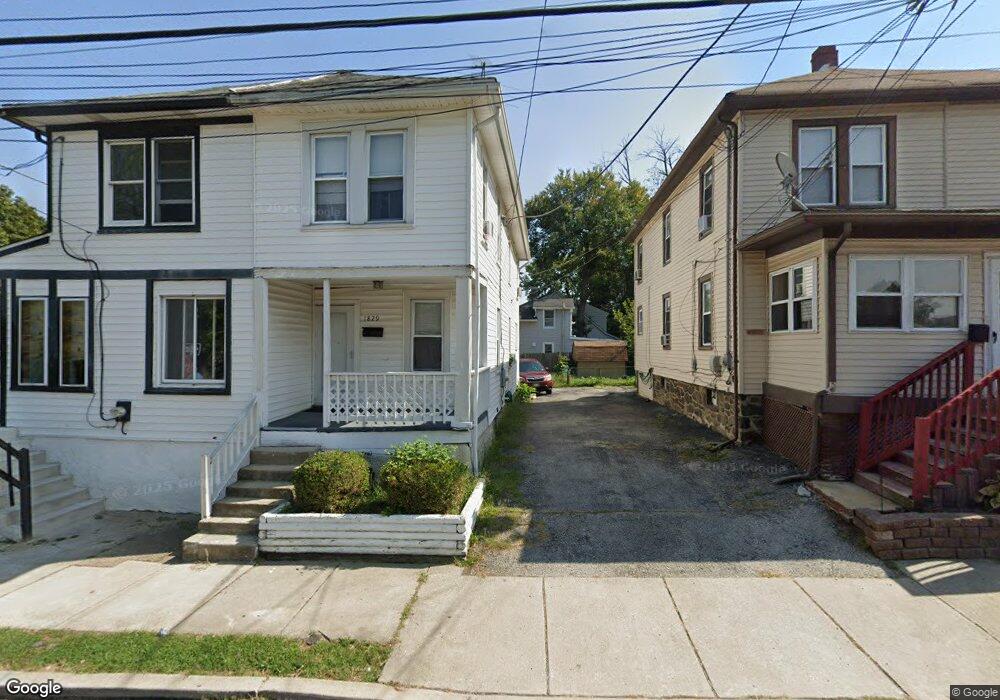
1829 Huddell Ave Upper Chichester, PA 19061
Upper Chichester Township NeighborhoodEstimated Value: $144,000 - $192,000
3
Beds
1
Bath
962
Sq Ft
$169/Sq Ft
Est. Value
About This Home
This home is located at 1829 Huddell Ave, Upper Chichester, PA 19061 and is currently estimated at $162,225, approximately $168 per square foot. 1829 Huddell Ave is a home located in Delaware County with nearby schools including Chichester Senior High School and Chester Charter School for the Arts.
Ownership History
Date
Name
Owned For
Owner Type
Purchase Details
Closed on
Jan 5, 2017
Sold by
Amico Anthony D and Amico April D
Bought by
Amico Anthony D
Current Estimated Value
Home Financials for this Owner
Home Financials are based on the most recent Mortgage that was taken out on this home.
Original Mortgage
$110,000
Outstanding Balance
$90,416
Interest Rate
4.03%
Mortgage Type
Commercial
Estimated Equity
$71,809
Purchase Details
Closed on
Jun 18, 2002
Sold by
Hud
Bought by
Damico Anthony and Damico April
Purchase Details
Closed on
Jan 8, 1997
Sold by
Kilgore Douglas O and Kilgore Amy M
Bought by
Kilgore Douglas O and Kilgore Amy M
Purchase Details
Closed on
May 30, 1996
Sold by
Hill Jay C and Hill Tara L
Bought by
Kilgore Douglas O and Mckinney Amy M
Home Financials for this Owner
Home Financials are based on the most recent Mortgage that was taken out on this home.
Original Mortgage
$79,850
Interest Rate
7.91%
Create a Home Valuation Report for This Property
The Home Valuation Report is an in-depth analysis detailing your home's value as well as a comparison with similar homes in the area
Home Values in the Area
Average Home Value in this Area
Purchase History
| Date | Buyer | Sale Price | Title Company |
|---|---|---|---|
| Amico Anthony D | -- | None Available | |
| Damico Anthony | $46,125 | T A Title Insurance Company | |
| Kilgore Douglas O | -- | -- | |
| Kilgore Douglas O | $80,000 | -- |
Source: Public Records
Mortgage History
| Date | Status | Borrower | Loan Amount |
|---|---|---|---|
| Open | Amico Anthony D | $110,000 | |
| Previous Owner | Kilgore Douglas O | $79,850 |
Source: Public Records
Tax History Compared to Growth
Tax History
| Year | Tax Paid | Tax Assessment Tax Assessment Total Assessment is a certain percentage of the fair market value that is determined by local assessors to be the total taxable value of land and additions on the property. | Land | Improvement |
|---|---|---|---|---|
| 2025 | $2,854 | $85,900 | $12,060 | $73,840 |
| 2024 | $2,854 | $85,900 | $12,060 | $73,840 |
| 2023 | $2,763 | $85,900 | $12,060 | $73,840 |
| 2022 | $2,695 | $85,900 | $12,060 | $73,840 |
| 2021 | $4,019 | $85,900 | $12,060 | $73,840 |
| 2020 | $3,352 | $66,480 | $22,250 | $44,230 |
| 2019 | $3,352 | $66,480 | $22,250 | $44,230 |
| 2018 | $3,361 | $66,480 | $0 | $0 |
| 2017 | $3,335 | $66,480 | $0 | $0 |
| 2016 | $365 | $66,480 | $0 | $0 |
| 2015 | $365 | $66,480 | $0 | $0 |
| 2014 | $365 | $66,480 | $0 | $0 |
Source: Public Records
Map
Nearby Homes
- 1829 Huddell St
- 1827 Huddell Ave
- 1831 Huddell Ave
- 1827 Huddell St
- 1825 Huddell Ave
- 1825 Huddell Ave
- 1825 Huddle St
- 1825 Huddell St
- 1821 Huddell Ave
- 1819 Huddell Ave
- 1901 Huddell Ave
- 1901 Huddell St
- 301 Johnson Ave
- 503 Johnson Ave
- 1903 Huddell Ave
- 505 Johnson Ave
- 1902 Huddell Ave
- 1813 Huddell Ave
- 507 Johnson Ave
- 1806 Huddell Ave