183 3rd St Newport, RI 02840
Estimated Value: $668,000 - $829,000
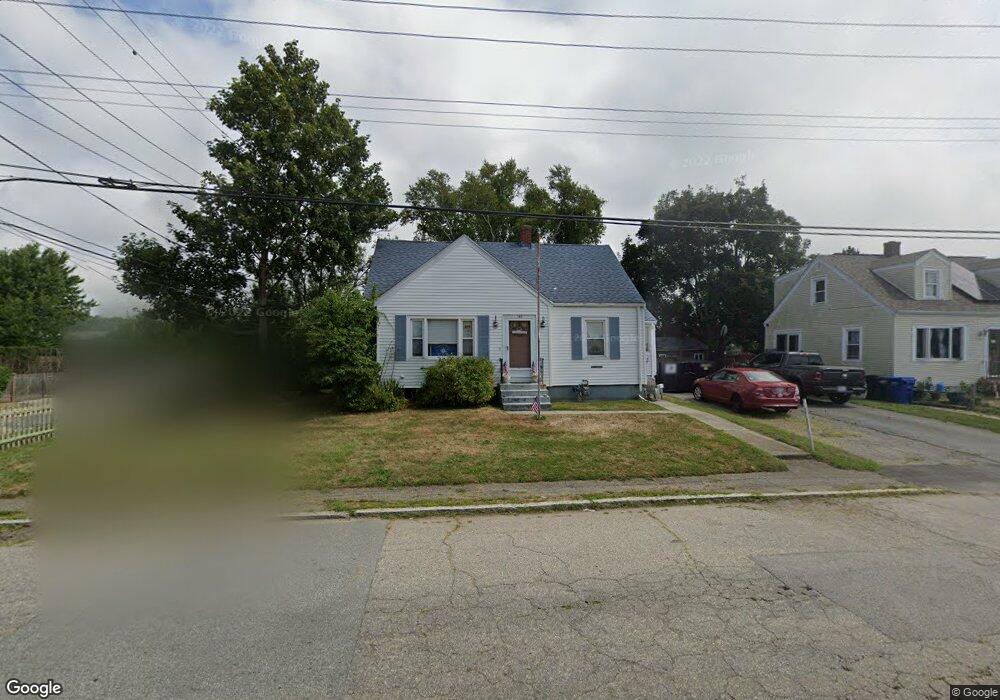
About This Home
This home is located at 183 3rd St, Newport, RI 02840 and is currently estimated at $716,868, approximately $560 per square foot. 183 3rd St is a home located in Newport County with nearby schools including Rogers High School, St Michael's Country Day School, and All Saints STEAM Academy.
Ownership History
We collect this data history from publicly available records. To have your information removed, we recommend requesting removal directly through your county’s website.
Purchase Details
Home Financials for this Owner
Home Financials are based on the most recent Mortgage that was taken out on this home.Purchase History
We collect this data history from publicly available records. To have your information removed, we recommend requesting removal directly through your county’s website.
| Date | Buyer | Sale Price | Title Company |
|---|---|---|---|
| $530,000 | None Available |
Mortgage History
We collect this data history from publicly available records. To have your information removed, we recommend requesting removal directly through your county’s website.
| Date | Status | Borrower | Loan Amount |
|---|---|---|---|
| Open | $520,400 |
Tax History
We collect this data history from publicly available records. To have your information removed, we recommend requesting removal directly through your county’s website.
| Year | Tax Paid | Tax Assessment Tax Assessment Total Assessment is a certain percentage of the fair market value that is determined by local assessors to be the total taxable value of land and additions on the property. | Land | Improvement |
|---|---|---|---|---|
| 2025 | $4,029 | $463,700 | $169,500 | $294,200 |
| 2024 | $3,812 | $463,700 | $169,500 | $294,200 |
| 2023 | $3,131 | $315,600 | $129,800 | $185,800 |
| 2022 | $3,033 | $315,600 | $129,800 | $185,800 |
| 2021 | $2,945 | $315,600 | $129,800 | $185,800 |
| 2020 | $2,796 | $272,000 | $98,800 | $173,200 |
| 2019 | $2,796 | $272,000 | $98,800 | $173,200 |
| 2018 | $2,717 | $272,000 | $98,800 | $173,200 |
| 2017 | $2,495 | $222,600 | $76,000 | $146,600 |
| 2016 | $2,433 | $222,600 | $76,000 | $146,600 |
| 2015 | $2,375 | $222,600 | $76,000 | $146,600 |
| 2014 | $2,505 | $207,700 | $56,000 | $151,700 |
Map
- 3 Sycamore St
- 23 Butler St
- 31 Prescott Hall Rd
- 54 Homer St
- 33 Halsey St
- 49 Third St
- 4 Van Zandt Ave
- 7 Sheffield Ave
- 74 Third St
- 57 Gould St
- 2 Prescott Place
- 16 Cummings Rd
- 18 Cummings Rd
- 66 Girard Ave Unit 114
- 15 Willow St
- 17 Willow St
- 17 Willow St Unit 3
- 17 Willow St Unit 2
- 17 Willow St Unit 1
- 51 Warner St
Ask me questions while you tour the home.