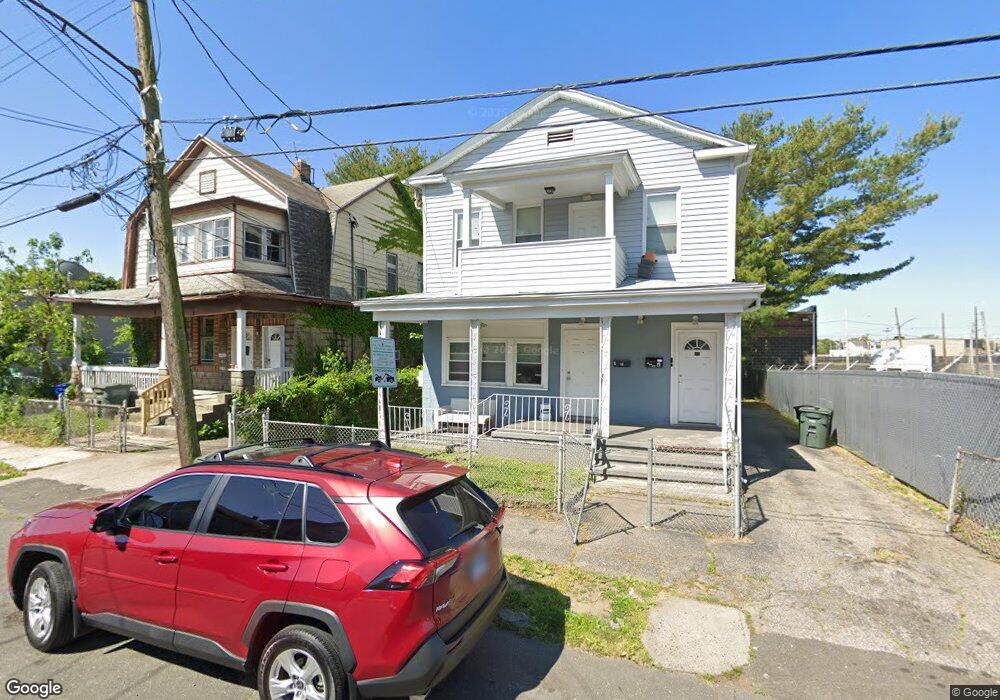
183 4th St Bridgeport, CT 06607
East End NeighborhoodEstimated Value: $346,000 - $366,000
4
Beds
2
Baths
1,848
Sq Ft
$193/Sq Ft
Est. Value
About This Home
This home is located at 183 4th St, Bridgeport, CT 06607 and is currently estimated at $356,000, approximately $192 per square foot. 183 4th St is a home located in Fairfield County with nearby schools including Dunbar School, Harding High School, and Capital Prep Harbor Upper School.
Ownership History
Date
Name
Owned For
Owner Type
Purchase Details
Closed on
Feb 14, 2020
Sold by
183 Fourth St Llc
Bought by
Constitution Portfolio 1
Current Estimated Value
Home Financials for this Owner
Home Financials are based on the most recent Mortgage that was taken out on this home.
Original Mortgage
$1,199,375
Outstanding Balance
$645,752
Interest Rate
3.6%
Mortgage Type
Balloon
Estimated Equity
-$289,752
Purchase Details
Closed on
Mar 16, 2018
Sold by
Benchmark Municipal Ta
Bought by
183 4Th St Llc
Home Financials for this Owner
Home Financials are based on the most recent Mortgage that was taken out on this home.
Original Mortgage
$102,600
Interest Rate
4.22%
Mortgage Type
New Conventional
Purchase Details
Closed on
Jan 11, 2018
Sold by
Bolling George and Benchmark Municipal Ta
Bought by
Benchmark Municipal Ta
Create a Home Valuation Report for This Property
The Home Valuation Report is an in-depth analysis detailing your home's value as well as a comparison with similar homes in the area
Home Values in the Area
Average Home Value in this Area
Purchase History
| Date | Buyer | Sale Price | Title Company |
|---|---|---|---|
| Constitution Portfolio 1 | -- | None Available | |
| Constitution Portfolio 1 | -- | None Available | |
| 183 4Th St Llc | -- | -- | |
| 183 4Th St Llc | -- | -- | |
| Benchmark Municipal Ta | -- | -- | |
| Benchmark Municipal Ta | -- | -- |
Source: Public Records
Mortgage History
| Date | Status | Borrower | Loan Amount |
|---|---|---|---|
| Open | Constitution Portfolio 1 | $1,199,375 | |
| Previous Owner | Benchmark Municipal Ta | $191,250 | |
| Previous Owner | Benchmark Municipal Ta | $102,600 |
Source: Public Records
Tax History
| Year | Tax Paid | Tax Assessment Tax Assessment Total Assessment is a certain percentage of the fair market value that is determined by local assessors to be the total taxable value of land and additions on the property. | Land | Improvement |
|---|---|---|---|---|
| 2025 | $5,148 | $118,490 | $30,720 | $87,770 |
| 2024 | $5,148 | $118,490 | $30,720 | $87,770 |
| 2023 | $5,148 | $118,490 | $30,720 | $87,770 |
| 2022 | $5,148 | $118,490 | $30,720 | $87,770 |
| 2021 | $5,148 | $118,490 | $30,720 | $87,770 |
| 2020 | $4,819 | $89,260 | $17,190 | $72,070 |
| 2019 | $4,819 | $89,260 | $17,190 | $72,070 |
| 2018 | $4,853 | $89,260 | $17,190 | $72,070 |
| 2017 | $4,853 | $89,260 | $17,190 | $72,070 |
| 2016 | $4,853 | $89,260 | $17,190 | $72,070 |
| 2015 | $5,734 | $135,880 | $29,460 | $106,420 |
| 2014 | $5,734 | $135,880 | $29,460 | $106,420 |
Source: Public Records
Map
Nearby Homes
- 179 4th St
- 384 Connecticut Ave Unit 386
- 221 Bunnell St
- 188 Holly St
- 40-42 5th St
- 93 Clifford St
- 643 Newfield Ave Unit 645
- 10 Ordnance Ct Unit 3
- 644 Carroll Ave Unit 5
- 445 Nichols St
- 60 Gilmore St Unit 21
- 800 Seaview Ave Unit 760-4
- 800 Seaview Ave Unit 770-5
- 800 Seaview Ave Unit 800-1
- 464 Wilmot Ave
- 73 Orange St
- 363 Carroll Ave Unit 365
- 537 Hollister Ave
- 1440 Stratford Ave
- 860 Connecticut Ave
- 183 4th St Unit 2
- 183 4th St Unit 1
- 183 4th St Unit 2nd floor
- 183 4th St Unit 1st floor
- 192 4th St
- 184 4th St
- 184 4th St Unit SECOND FLOOR
- 184 4th St Unit FIRST FLOOR
- 198 4th St
- 176 4th St
- 206 4th St
- 166 4th St
- 160 4th St
- 160 4th St Unit 1st Floor
- 183 5th St
- 150 4th St
- 169 5th St
- 191 5th St
- 173 5th St
- 173 5th St Unit 3
Your Personal Tour Guide
Ask me questions while you tour the home.