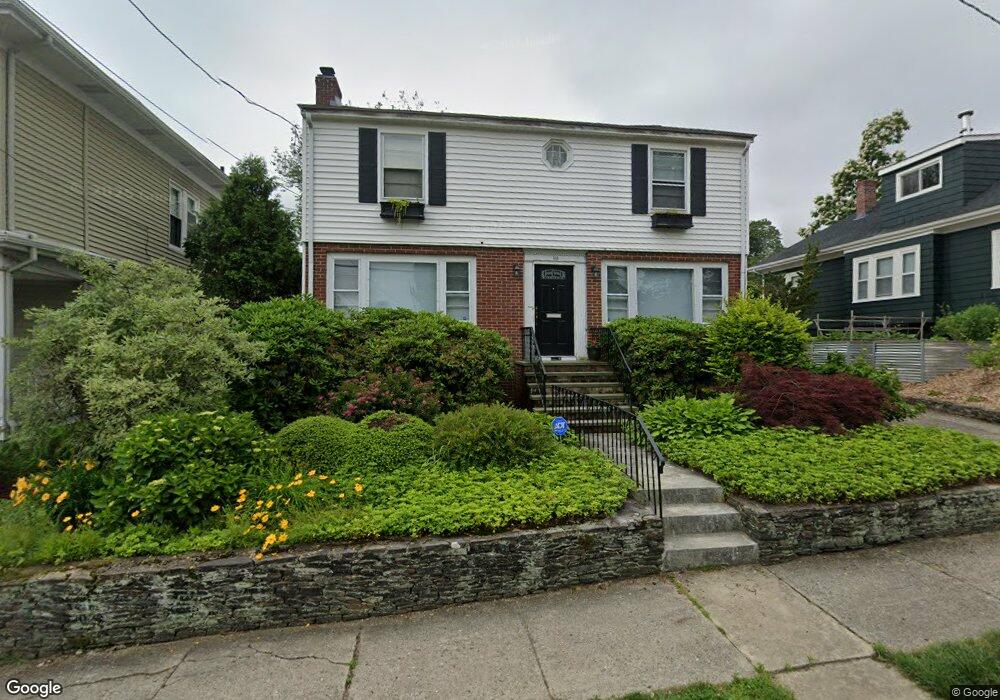
183 9th St Providence, RI 02906
Hope NeighborhoodEstimated Value: $706,000 - $815,000
3
Beds
2
Baths
2,516
Sq Ft
$310/Sq Ft
Est. Value
About This Home
This home is located at 183 9th St, Providence, RI 02906 and is currently estimated at $780,341, approximately $310 per square foot. 183 9th St is a home located in Providence County with nearby schools including Asa Messer Elementary School, Charles N. Fortes Elementary School, and Veazie Street Elementary School.
Ownership History
Date
Name
Owned For
Owner Type
Purchase Details
Closed on
Dec 16, 2011
Sold by
Horowitz Jerome and Horowitz Irene
Bought by
Coney Isaac J and Burkett Rodney A
Current Estimated Value
Home Financials for this Owner
Home Financials are based on the most recent Mortgage that was taken out on this home.
Original Mortgage
$195,000
Outstanding Balance
$135,595
Interest Rate
4.01%
Mortgage Type
Purchase Money Mortgage
Estimated Equity
$644,746
Create a Home Valuation Report for This Property
The Home Valuation Report is an in-depth analysis detailing your home's value as well as a comparison with similar homes in the area
Home Values in the Area
Average Home Value in this Area
Purchase History
| Date | Buyer | Sale Price | Title Company |
|---|---|---|---|
| Coney Isaac J | $870,000 | -- | |
| Coney Isaac J | $870,000 | -- |
Source: Public Records
Mortgage History
| Date | Status | Borrower | Loan Amount |
|---|---|---|---|
| Open | Coney Isaac J | $195,000 | |
| Closed | Coney Isaac J | $195,000 |
Source: Public Records
Tax History Compared to Growth
Tax History
| Year | Tax Paid | Tax Assessment Tax Assessment Total Assessment is a certain percentage of the fair market value that is determined by local assessors to be the total taxable value of land and additions on the property. | Land | Improvement |
|---|---|---|---|---|
| 2025 | $5,288 | $629,500 | $372,200 | $257,300 |
| 2024 | $9,067 | $494,100 | $250,800 | $243,300 |
| 2023 | $9,067 | $494,100 | $250,800 | $243,300 |
| 2022 | $8,795 | $494,100 | $250,800 | $243,300 |
| 2021 | $9,365 | $381,300 | $201,700 | $179,600 |
| 2020 | $9,365 | $381,300 | $201,700 | $179,600 |
| 2019 | $9,365 | $381,300 | $201,700 | $179,600 |
| 2018 | $10,841 | $339,200 | $174,700 | $164,500 |
| 2017 | $10,841 | $339,200 | $174,700 | $164,500 |
| 2016 | $10,841 | $339,200 | $174,700 | $164,500 |
| 2015 | $9,771 | $295,200 | $163,000 | $132,200 |
| 2014 | $9,963 | $295,200 | $163,000 | $132,200 |
| 2013 | $9,963 | $295,200 | $163,000 | $132,200 |
Source: Public Records
Map
Nearby Homes
- 132 11th St
- 62 Overhill Rd
- 151 Chace Ave
- 873 Hope St
- 172 Chace Ave
- 141 Hillside Ave
- 136 Hillside Ave
- 750 Elmgrove Ave
- 62 Harwich Rd
- 640 Elmgrove Ave
- 767 Elmgrove Ave
- 540 Blackstone Blvd
- 41 Wingate Rd
- 32 Carver St
- 122 Lowden St
- 32 Glendale Ave
- 142 Ridge St
- 202 Rochambeau Ave Unit 2
- 436 Blackstone Blvd
- 640 East Ave