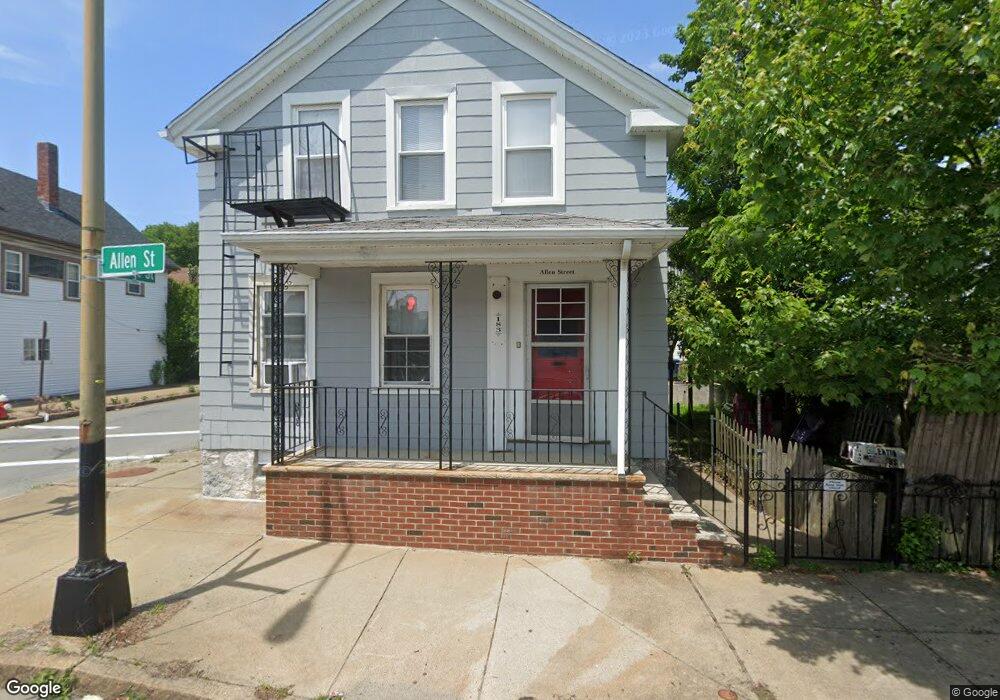
183 Allen St New Bedford, MA 02740
Downtown New Bedford NeighborhoodEstimated Value: $374,000 - $468,000
3
Beds
2
Baths
1,329
Sq Ft
$319/Sq Ft
Est. Value
About This Home
This home is located at 183 Allen St, New Bedford, MA 02740 and is currently estimated at $424,029, approximately $319 per square foot. 183 Allen St is a home located in Bristol County with nearby schools including Betsey B. Winslow Elementary School, Keith Middle School, and New Bedford High School.
Ownership History
Date
Name
Owned For
Owner Type
Purchase Details
Closed on
Apr 22, 1993
Sold by
Natl City Mtg Co
Bought by
Quann Maria F and Martins Alice R
Current Estimated Value
Home Financials for this Owner
Home Financials are based on the most recent Mortgage that was taken out on this home.
Original Mortgage
$146,000
Interest Rate
7.45%
Mortgage Type
Purchase Money Mortgage
Purchase Details
Closed on
Dec 1, 1992
Sold by
Britt R Becca
Bought by
Natl City Mtg Co
Purchase Details
Closed on
Jun 9, 1987
Sold by
Medeiros Joao B
Bought by
Britt R Becca
Home Financials for this Owner
Home Financials are based on the most recent Mortgage that was taken out on this home.
Original Mortgage
$89,300
Interest Rate
10.38%
Mortgage Type
Purchase Money Mortgage
Create a Home Valuation Report for This Property
The Home Valuation Report is an in-depth analysis detailing your home's value as well as a comparison with similar homes in the area
Home Values in the Area
Average Home Value in this Area
Purchase History
| Date | Buyer | Sale Price | Title Company |
|---|---|---|---|
| Quann Maria F | $52,000 | -- | |
| Quann Maria F | $52,000 | -- | |
| Natl City Mtg Co | $42,000 | -- | |
| Natl City Mtg Co | $42,000 | -- | |
| Britt R Becca | $94,000 | -- |
Source: Public Records
Mortgage History
| Date | Status | Borrower | Loan Amount |
|---|---|---|---|
| Closed | Britt R Becca | $146,000 | |
| Previous Owner | Britt R Becca | $89,300 |
Source: Public Records
Tax History Compared to Growth
Tax History
| Year | Tax Paid | Tax Assessment Tax Assessment Total Assessment is a certain percentage of the fair market value that is determined by local assessors to be the total taxable value of land and additions on the property. | Land | Improvement |
|---|---|---|---|---|
| 2025 | $4,056 | $358,600 | $87,600 | $271,000 |
| 2024 | $3,587 | $298,900 | $84,500 | $214,400 |
| 2023 | $3,452 | $241,600 | $70,700 | $170,900 |
| 2022 | $3,066 | $197,300 | $68,900 | $128,400 |
| 2021 | $3,026 | $194,100 | $65,700 | $128,400 |
| 2020 | $2,881 | $178,300 | $65,700 | $112,600 |
| 2019 | $2,826 | $171,600 | $65,700 | $105,900 |
| 2018 | $2,667 | $160,400 | $65,700 | $94,700 |
| 2017 | $2,462 | $147,500 | $67,300 | $80,200 |
| 2016 | $2,383 | $144,500 | $67,300 | $77,200 |
| 2015 | $2,232 | $141,900 | $67,300 | $74,600 |
| 2014 | $2,157 | $142,300 | $67,300 | $75,000 |
Source: Public Records
Map
Nearby Homes
- 177 Allen St
- 177 Allen St Unit Allen St
- 38-40 Cottage St
- 38 Cottage St Unit 40
- 191 Allen St
- 32 Cottage St
- 42 Cottage St Unit 44
- 42-44 Cottage St
- 173 Allen St
- 41 Cottage St
- 193 Allen St
- 30 Cottage St
- 176 Allen St
- 176 Allen St Unit 3
- 46 Cottage St
- 180 Allen St
- 47 Cottage St
- 31 Cottage St
- 28 Cottage St
- 48 Cottage St