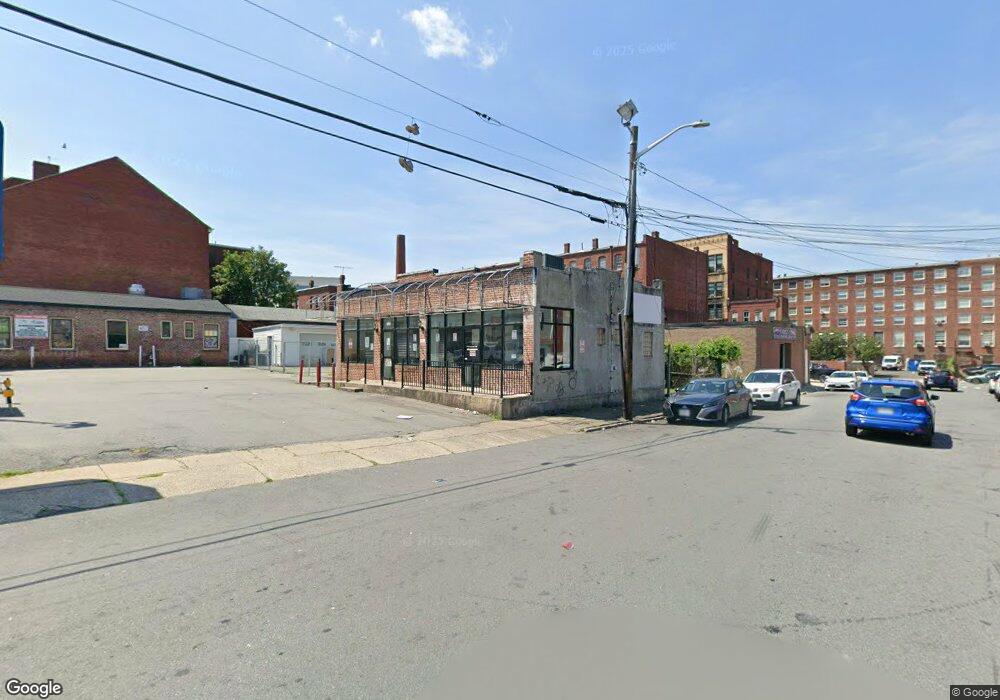
183 Appleton St Lowell, MA 01852
Estimated Value: $514,007
Studio
1
Bath
1,200
Sq Ft
$428/Sq Ft
Est. Value
About This Home
This home is located at 183 Appleton St, Lowell, MA 01852 and is currently estimated at $514,007, approximately $428 per square foot. 183 Appleton St is a home located in Middlesex County with nearby schools including Abraham Lincoln Elementary School, Moody Elementary School, and Greenhalge Elementary School.
Ownership History
Date
Name
Owned For
Owner Type
Purchase Details
Closed on
Apr 18, 2000
Sold by
Silva Bros Investment
Bought by
Appleton St Nt and Tavares Vasiliki P
Current Estimated Value
Home Financials for this Owner
Home Financials are based on the most recent Mortgage that was taken out on this home.
Original Mortgage
$140,000
Outstanding Balance
$48,067
Interest Rate
8.26%
Mortgage Type
Commercial
Estimated Equity
$465,940
Create a Home Valuation Report for This Property
The Home Valuation Report is an in-depth analysis detailing your home's value as well as a comparison with similar homes in the area
Purchase History
| Date | Buyer | Sale Price | Title Company |
|---|---|---|---|
| Appleton St Nt | $160,000 | -- | |
| Appleton St Nt | $160,000 | -- |
Source: Public Records
Mortgage History
| Date | Status | Borrower | Loan Amount |
|---|---|---|---|
| Open | Appleton St Nt | $46,000 | |
| Open | Appleton St Nt | $140,000 | |
| Closed | Appleton St Nt | $140,000 |
Source: Public Records
Tax History
| Year | Tax Paid | Tax Assessment Tax Assessment Total Assessment is a certain percentage of the fair market value that is determined by local assessors to be the total taxable value of land and additions on the property. | Land | Improvement |
|---|---|---|---|---|
| 2025 | $5,129 | $229,300 | $120,400 | $108,900 |
| 2024 | $5,098 | $219,100 | $114,700 | $104,400 |
| 2023 | $4,974 | $204,200 | $104,300 | $99,900 |
| 2022 | $5,084 | $201,900 | $104,300 | $97,600 |
| 2021 | $4,993 | $186,100 | $90,700 | $95,400 |
| 2020 | $4,982 | $186,100 | $90,700 | $95,400 |
| 2019 | $5,192 | $181,600 | $90,700 | $90,900 |
| 2018 | $5,102 | $173,900 | $86,400 | $87,500 |
| 2017 | $5,258 | $171,600 | $86,400 | $85,200 |
| 2016 | $5,645 | $180,800 | $86,400 | $94,400 |
| 2015 | $5,869 | $180,800 | $86,400 | $94,400 |
| 2013 | $5,894 | $188,200 | $95,900 | $92,300 |
Source: Public Records
Map
Nearby Homes
- 278-316 Middlesex St
- 491 Dutton St Unit 305
- 491 Dutton St Unit 409
- 491 Dutton St Unit 504
- 200 Market St Unit 3010
- 200 Market St Unit 619
- 200 Market St Unit 3308
- 200 Market St Unit 115
- 200 Market St Unit 103
- 30 Market St Unit 7
- 191 Thorndike St Unit 26
- 201 Thorndike St Unit 501
- 201 Thorndike St Unit 2-312
- 201 Thorndike St Unit 505
- 61 Market St Unit 2B
- 95 S Highland St
- 39 Groves Ave
- 23-33 Middle St Unit 6
- 23-33 Middle St Unit 21
- 23-33 Middle St Unit 11
- 191 Appleton St
- 193 Appleton St Unit 6
- 193 Appleton St Unit 7
- 193 Appleton St Unit 5
- 193 Appleton St Unit 4
- 193 Appleton St Unit 3
- 193 Appleton St Unit 2
- 193 Appleton St Unit 1
- 193 Appleton St
- 17 South St
- 16 South St
- 26 South St
- 197 Appleton St Unit 123
- 197 Appleton St Unit 125
- 197 Appleton St
- 182 Middlesex St
- 190 Middlesex St
- 192 Middlesex St
- 160 Middlesex St
- 170 Appleton St
Your Personal Tour Guide
Ask me questions while you tour the home.