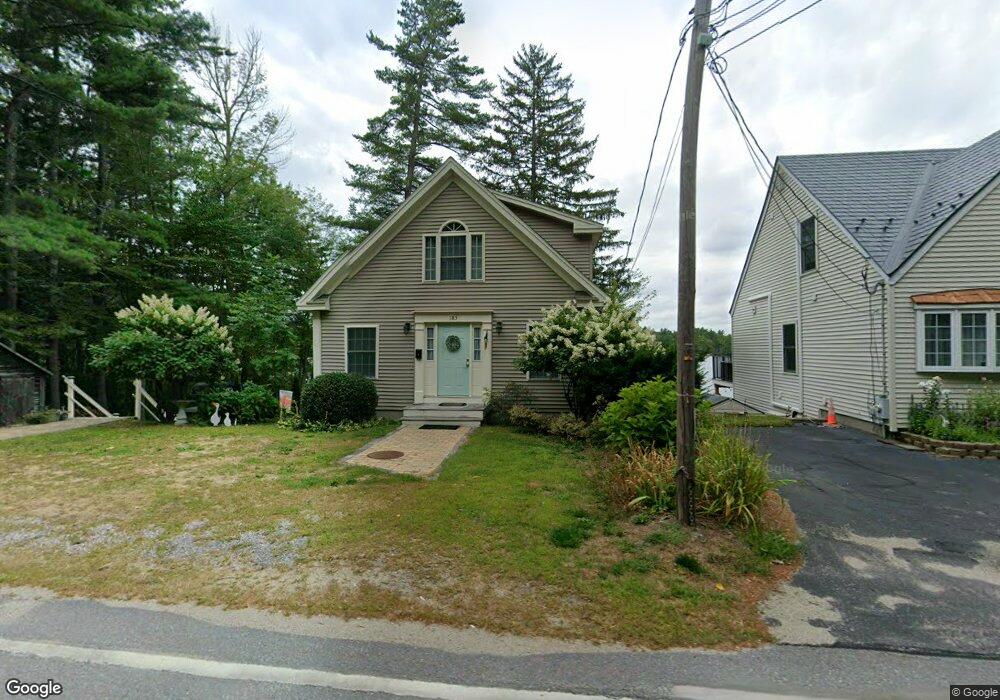
183 Ashby Rd Ashburnham, MA 01430
Estimated Value: $533,960 - $682,000
2
Beds
3
Baths
1,992
Sq Ft
$299/Sq Ft
Est. Value
About This Home
This home is located at 183 Ashby Rd, Ashburnham, MA 01430 and is currently estimated at $595,740, approximately $299 per square foot. 183 Ashby Rd is a home located in Worcester County with nearby schools including Oakmont Regional High School and Cushing Academy.
Ownership History
Date
Name
Owned For
Owner Type
Purchase Details
Closed on
Mar 6, 2025
Sold by
Ufnal Michael H and Ufnal Karen M
Bought by
Michael & Karen Ufnal Ret and Ufnal
Current Estimated Value
Purchase Details
Closed on
Jul 26, 2021
Sold by
Dipaoli Richard and Workers Cu
Bought by
Ufnal Michael H and Ufnal Karen M
Purchase Details
Closed on
Jun 29, 1995
Sold by
Clancy Margaret
Bought by
Tee Trust and Evancic Geoffrey A
Create a Home Valuation Report for This Property
The Home Valuation Report is an in-depth analysis detailing your home's value as well as a comparison with similar homes in the area
Home Values in the Area
Average Home Value in this Area
Purchase History
| Date | Buyer | Sale Price | Title Company |
|---|---|---|---|
| Michael & Karen Ufnal Ret | -- | None Available | |
| Michael & Karen Ufnal Ret | -- | None Available | |
| Ufnal Michael H | $381,000 | None Available | |
| Ufnal Michael H | $381,000 | None Available | |
| Tee Trust | $5,000 | -- | |
| Tee Trust | $5,000 | -- |
Source: Public Records
Tax History
| Year | Tax Paid | Tax Assessment Tax Assessment Total Assessment is a certain percentage of the fair market value that is determined by local assessors to be the total taxable value of land and additions on the property. | Land | Improvement |
|---|---|---|---|---|
| 2025 | $7,987 | $537,100 | $121,600 | $415,500 |
| 2024 | $7,369 | $467,900 | $121,600 | $346,300 |
| 2023 | $7,128 | $430,700 | $121,600 | $309,100 |
| 2022 | $6,144 | $325,400 | $103,600 | $221,800 |
| 2021 | $6,015 | $292,700 | $103,600 | $189,100 |
| 2020 | $5,883 | $292,700 | $103,600 | $189,100 |
| 2019 | $5,466 | $242,400 | $97,700 | $144,700 |
| 2018 | $5,209 | $222,600 | $93,000 | $129,600 |
| 2017 | $5,143 | $223,900 | $98,900 | $125,000 |
| 2016 | $5,324 | $234,000 | $96,900 | $137,100 |
| 2015 | $5,214 | $234,000 | $96,900 | $137,100 |
Source: Public Records
Map
Nearby Homes
- 152 Ashby Rd
- 57 Ashby Rd
- 0 Rindge Turnpike
- Lot 3 W State Rd
- 10 Central St
- 100 Main St
- 14 Central St
- 151 Wilker Rd
- 9 Willard Rd
- 44 Rindge State Rd
- 18 Corey Hill Rd
- 2409 W State Rd
- 36 Hillandale Rd
- 75 Willard Rd
- 26 Wellington Rd
- 6 Wyman Rd
- 72 Park Rd
- 162 Sherbert Rd
- 0 Winding Cove Rd Unit 73431444
- 137 Deer Bay Rd
Your Personal Tour Guide
Ask me questions while you tour the home.