Estimated Value: $281,000 - $300,000
--
Bed
--
Bath
2,523
Sq Ft
$115/Sq Ft
Est. Value
About This Home
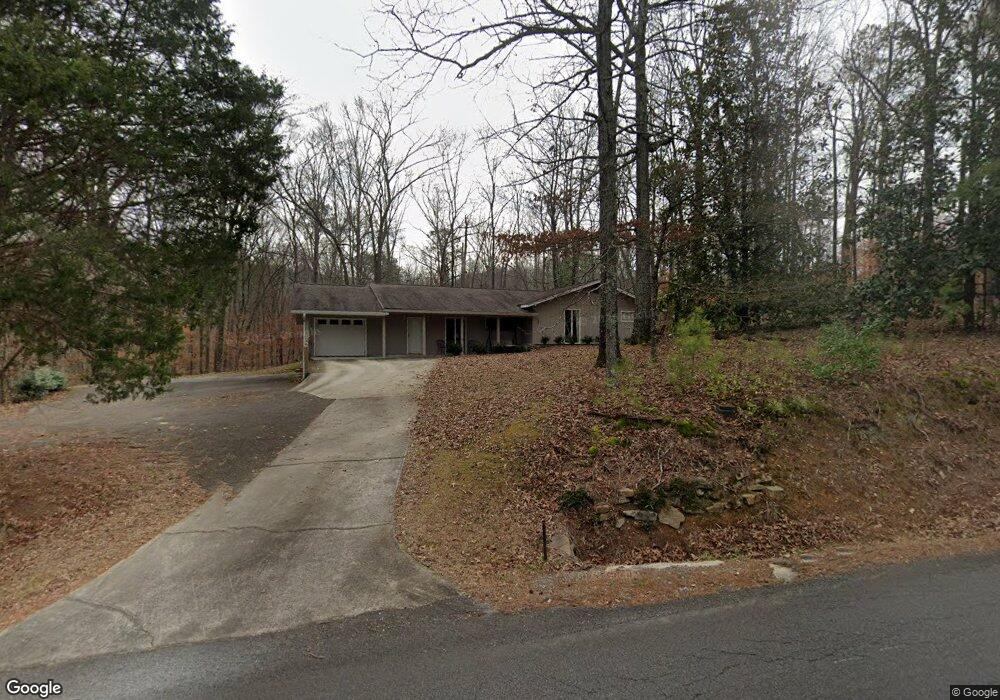
This home is located at 183 Barker Rd SW, Rome, GA 30165 and is currently estimated at $290,325, approximately $115 per square foot. 183 Barker Rd SW is a home located in Floyd County with nearby schools including Coosa Middle School and Coosa High School.
Ownership History
Date
Name
Owned For
Owner Type
Purchase Details
Closed on
Jun 14, 2013
Sold by
Fuller Lisa Renee Lawler
Bought by
Fuller Alan and Fuller Lisa
Current Estimated Value
Purchase Details
Closed on
Nov 19, 1997
Sold by
Lawler Bobby Ralph and Lawler Faye
Bought by
Lawler Violet Faye
Purchase Details
Closed on
Oct 21, 1972
Sold by
P\R
Bought by
Lawler Bobby Ralph and Lawler Faye
Purchase Details
Closed on
Dec 26, 1967
Sold by
Oyler Frank and Oyler Kathleen
Bought by
P\R
Purchase Details
Closed on
Oct 26, 1967
Sold by
Stokes T E Etal
Bought by
Oyler Frank and Oyler Kathleen
Purchase Details
Closed on
Jan 1, 1901
Bought by
Stokes T E Etal
Create a Home Valuation Report for This Property
The Home Valuation Report is an in-depth analysis detailing your home's value as well as a comparison with similar homes in the area
Home Values in the Area
Average Home Value in this Area
Purchase History
| Date | Buyer | Sale Price | Title Company |
|---|---|---|---|
| Fuller Alan | -- | -- | |
| Fuller Lisa Renee Lawler | -- | -- | |
| Lawler Violet Faye | -- | -- | |
| Lawler Bobby Ralph | $2,500 | -- | |
| P\R | -- | -- | |
| Oyler Frank | $500 | -- | |
| Stokes T E Etal | -- | -- |
Source: Public Records
Tax History Compared to Growth
Tax History
| Year | Tax Paid | Tax Assessment Tax Assessment Total Assessment is a certain percentage of the fair market value that is determined by local assessors to be the total taxable value of land and additions on the property. | Land | Improvement |
|---|---|---|---|---|
| 2024 | $1,837 | $89,664 | $17,766 | $71,898 |
| 2023 | $2,471 | $86,186 | $15,792 | $70,394 |
| 2022 | $1,898 | $63,973 | $12,831 | $51,142 |
| 2021 | $1,799 | $59,603 | $12,831 | $46,772 |
| 2020 | $1,670 | $54,885 | $9,870 | $45,015 |
| 2019 | $1,593 | $53,029 | $9,870 | $43,159 |
| 2018 | $1,537 | $51,076 | $9,870 | $41,206 |
| 2017 | $1,511 | $50,114 | $9,870 | $40,244 |
| 2016 | $1,515 | $49,636 | $9,840 | $39,796 |
| 2015 | $1,454 | $50,316 | $9,840 | $40,476 |
| 2014 | $1,454 | $51,676 | $9,840 | $41,836 |
Source: Public Records
Map
Nearby Homes
- 3105 Barker Rd SW
- 89 Barker Rd SW
- 3329 Alabama Hwy SW
- 2890 Alabama Hwy NW
- 125 Thornwood Dr SW
- 124 Beech Creek Dr NW
- 120 Thornwood Dr SW
- 106 Eden Dr NW
- 10 Bush Arbor Place SW
- 104 Beech Creek Dr NW
- 8 Bush Arbor Place SW
- 102 Beech Creek Dr NW
- 4003 Garden Lakes Pkwy NW
- 16 Drexel Dr NW
- 8 Cameo Dr NW
- 203 Hycliff Rd SW
- 224 Rolling Oaks Dr NW
- 30 Polaris Terrace NW
- 7 Eden Dr NW
- 2604 Shorter Ave NW
- 205 Barker Rd SW
- 247 Barker Rd SW
- 16 Grandview Dr SW
- 137 Barker Rd SW
- 261 Barker Rd SW
- 129 Barker Rd SW
- 33 Grandview Dr SW
- 33 Grandview Dr SW
- 33 Grandview Dr SW
- 33 Grandview Dr SW
- 0 Grandview Dr SW Unit 20146388
- 0 Grandview Dr SW Unit 7274626
- 0 Grandview Dr SW Unit 149/150 8801457
- 6 Beacon Dr SW
- 6 Beacon Dr SW
- 6 Beacon Dr SW
- 6 Beacon Dr SW
- 117 Barker Rd SW
- 13 Grandview Dr SW
- 12 Grandview Dr SW