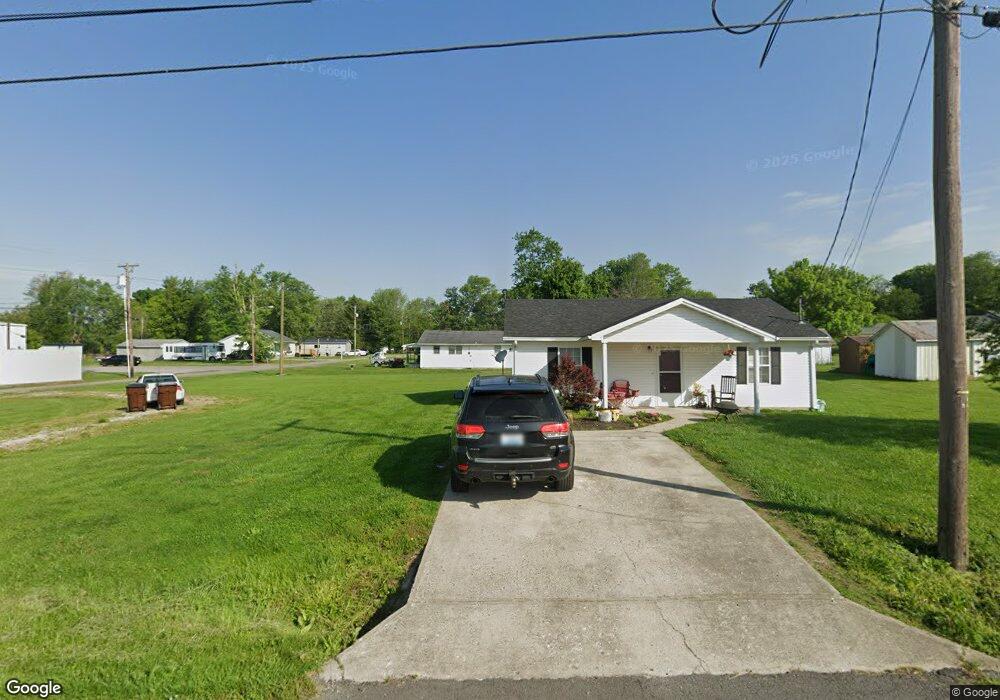
183 Cedar St Crab Orchard, KY 40419
Estimated Value: $81,000 - $123,000
2
Beds
1
Bath
830
Sq Ft
$123/Sq Ft
Est. Value
About This Home
This home is located at 183 Cedar St, Crab Orchard, KY 40419 and is currently estimated at $101,852, approximately $122 per square foot. 183 Cedar St is a home located in Lincoln County with nearby schools including Lincoln County High School.
Ownership History
Date
Name
Owned For
Owner Type
Purchase Details
Closed on
Jul 16, 2021
Sold by
Ross Ashley and Ross Jacob H
Bought by
Young Emily Rain and Smith Isaiah Dean
Current Estimated Value
Home Financials for this Owner
Home Financials are based on the most recent Mortgage that was taken out on this home.
Original Mortgage
$77,777
Outstanding Balance
$70,571
Interest Rate
2.9%
Mortgage Type
New Conventional
Estimated Equity
$31,281
Purchase Details
Closed on
Feb 28, 2020
Sold by
Singleton Charles and Singleton Heather
Bought by
Simpson Ashley Paige and Ross Jacob H
Home Financials for this Owner
Home Financials are based on the most recent Mortgage that was taken out on this home.
Original Mortgage
$60,630
Interest Rate
3.6%
Mortgage Type
FHA
Purchase Details
Closed on
Oct 16, 2010
Sold by
Shelton Viola Dale and Julian Viola Dale
Bought by
Smith Glenn E and Smith Mary E
Create a Home Valuation Report for This Property
The Home Valuation Report is an in-depth analysis detailing your home's value as well as a comparison with similar homes in the area
Home Values in the Area
Average Home Value in this Area
Purchase History
| Date | Buyer | Sale Price | Title Company |
|---|---|---|---|
| Young Emily Rain | $77,000 | Bluegrass Land Title Llc | |
| Simpson Ashley Paige | $61,750 | Bluegrass Land Title Llc | |
| Smith Glenn E | $53,500 | None Available |
Source: Public Records
Mortgage History
| Date | Status | Borrower | Loan Amount |
|---|---|---|---|
| Open | Young Emily Rain | $77,777 | |
| Previous Owner | Simpson Ashley Paige | $60,630 |
Source: Public Records
Tax History Compared to Growth
Tax History
| Year | Tax Paid | Tax Assessment Tax Assessment Total Assessment is a certain percentage of the fair market value that is determined by local assessors to be the total taxable value of land and additions on the property. | Land | Improvement |
|---|---|---|---|---|
| 2024 | $740 | $77,000 | $20,000 | $57,000 |
| 2023 | $748 | $77,000 | $20,000 | $57,000 |
| 2022 | $749 | $77,000 | $20,000 | $57,000 |
| 2021 | $616 | $61,750 | $0 | $0 |
| 2020 | $546 | $53,500 | $0 | $0 |
| 2019 | $552 | $53,500 | $0 | $0 |
| 2018 | $546 | $53,500 | $0 | $0 |
| 2017 | -- | $53,500 | $0 | $0 |
| 2016 | $536 | $53,500 | $0 | $0 |
| 2015 | $442 | $53,500 | $0 | $0 |
| 2012 | $442 | $53,500 | $7,000 | $46,500 |
Source: Public Records
Map
Nearby Homes
- 3975 Highway 39
- 99999 Highway 39
- 137 Meadowlark Dr
- 75 Viola St
- 9999 Fletcher Ln
- 164 Lancaster St
- 8890 Us-Hwy 150e
- 1875 Kentucky 39
- 1179 William Whitley Rd
- 65 State Highway 3246
- 54 Thraser Ln
- 945 S Harmons Lick Rd
- 3244 Kentucky 39
- 9550 Dysart Way
- 707 Slate Branch Rd
- 4177 Boone Rd
- 4687 Kentucky 39
- 3118 Hamilton Valley Rd
- 4796 Old U S 150 E
- 261 Arvil Ln