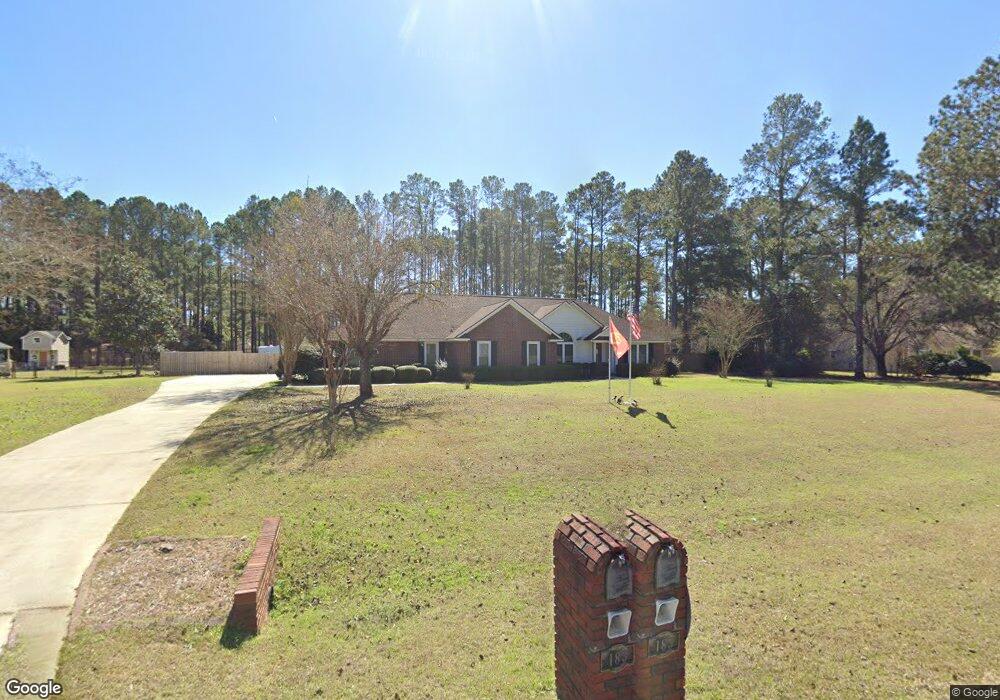
183 Cobblefield Dr Albany, GA 31701
Philema NeighborhoodEstimated Value: $264,000 - $294,000
3
Beds
2
Baths
1,908
Sq Ft
$144/Sq Ft
Est. Value
About This Home
This home is located at 183 Cobblefield Dr, Albany, GA 31701 and is currently estimated at $275,599, approximately $144 per square foot. 183 Cobblefield Dr is a home located in Lee County with nearby schools including Kinchafoonee Primary School, Twin Oaks Elementary School, and Lee County Middle School East.
Ownership History
Date
Name
Owned For
Owner Type
Purchase Details
Closed on
Nov 30, 2016
Sold by
Ayotte Ronald V
Bought by
Henderson Demarius E
Current Estimated Value
Home Financials for this Owner
Home Financials are based on the most recent Mortgage that was taken out on this home.
Original Mortgage
$154,246
Outstanding Balance
$122,643
Interest Rate
3.54%
Mortgage Type
VA
Estimated Equity
$152,956
Purchase Details
Closed on
Dec 1, 2002
Sold by
Prudential Relocatio
Bought by
Ayotte Ronald V
Purchase Details
Closed on
Nov 1, 2002
Sold by
Root Robert and Root Angela
Bought by
Prudential Relocatio
Purchase Details
Closed on
Jun 1, 1998
Sold by
Standard Homes Of Al
Bought by
Root Robert and Root Angela
Purchase Details
Closed on
Mar 1, 1998
Sold by
Century Dev Of
Bought by
Standard Homes Of Al
Purchase Details
Closed on
Jul 15, 1996
Sold by
Highland Properties
Bought by
Century Dev Of
Create a Home Valuation Report for This Property
The Home Valuation Report is an in-depth analysis detailing your home's value as well as a comparison with similar homes in the area
Home Values in the Area
Average Home Value in this Area
Purchase History
| Date | Buyer | Sale Price | Title Company |
|---|---|---|---|
| Henderson Demarius E | $151,000 | -- | |
| Ayotte Ronald V | -- | -- | |
| Prudential Relocatio | -- | -- | |
| Root Robert | $124,700 | -- | |
| Standard Homes Of Al | $17,000 | -- | |
| Century Dev Of | $88,700 | -- |
Source: Public Records
Mortgage History
| Date | Status | Borrower | Loan Amount |
|---|---|---|---|
| Open | Henderson Demarius E | $154,246 |
Source: Public Records
Tax History
| Year | Tax Paid | Tax Assessment Tax Assessment Total Assessment is a certain percentage of the fair market value that is determined by local assessors to be the total taxable value of land and additions on the property. | Land | Improvement |
|---|---|---|---|---|
| 2025 | -- | $111,080 | $8,000 | $103,080 |
| 2024 | -- | $75,960 | $8,000 | $67,960 |
| 2023 | $0 | $75,960 | $8,000 | $67,960 |
| 2022 | $2,144 | $75,960 | $8,000 | $67,960 |
| 2021 | $2,144 | $75,960 | $8,000 | $67,960 |
| 2020 | $1,891 | $56,120 | $8,920 | $47,200 |
| 2019 | $1,891 | $56,120 | $8,920 | $47,200 |
| 2018 | $0 | $56,120 | $8,920 | $47,200 |
| 2017 | $1,791 | $56,120 | $8,920 | $47,200 |
| 2016 | $1,791 | $56,120 | $8,920 | $47,200 |
| 2015 | $1,738 | $56,120 | $8,920 | $47,200 |
| 2014 | $1,744 | $56,120 | $8,920 | $47,200 |
| 2013 | -- | $56,120 | $8,920 | $47,200 |
Source: Public Records
Map
Nearby Homes
- 136 Cobblefield Dr
- 1406 River Pointe Dr
- 1711 River Pointe Dr
- 1302 Congressional Ct
- 1308 Congressional Ct
- 1710 River Pointe Dr
- 1408 River Pointe Dr
- 1901 River Pointe Dr
- 1502 River Pointe Dr
- 1510 River Pointe Dr
- 1811 River Pointe Dr
- 1508 River Pointe Dr
- 1514 River Pointe Dr
- 1600 River Pointe Dr
- 1312 River Pointe Dr
- 1610 River Pointe Dr
- 1706 River Pointe Dr
- 1511 River Pointe Dr
- 1513 River Pointe Dr
- 1407 River Pointe Dr
- 177 Cobblefield Dr
- 189 Cobblefield Dr
- 113 Post Ct
- 171 Cobblefield Dr
- 178 Cobblefield Dr
- 184 Cobblefield Dr
- 172 Cobblefield Dr
- 201 Cobblefield Dr
- 190 Cobblefield Dr
- 119 Post Ct
- 110 Post Ct
- 165 Cobblefield Dr
- 196 Cobblefield Dr
- 261 Highland Oaks Dr
- 118 Post Ct
- 114 Post Ct
- 255 Highland Oaks Dr
- 166 Cobblefield Dr
- 207 Cobblefield Dr
- 202 Cobblefield Dr
Your Personal Tour Guide
Ask me questions while you tour the home.